Because this piece does not have an abstract, we have provided for your benefit the first 3 sentences of the full text.
To the Editor: We are writing in regard to our paper "Prolactin Levels During Long-Term Risperidone Treatment in Children and Adolescents," published in the November 2003 issue of JCP. The reason for this letter is to respond to concerns raised about this paper both during court proceedings and within the lay media. Janssen is a defendant in these legal cases.
See article by Findling et al
This work may not be copied, distributed, displayed, published, reproduced, transmitted, modified, posted, sold, licensed, or used for commercial purposes. By downloading this file, you are agreeing to the publisher’s Terms & Conditions.
Prolactin Levels During Long-Term Risperidone Treatment in Children and Adolescents: A Reanalysis of Data
To the Editor: We are writing in regard to our paper "Prolactin Levels During Long-Term Risperidone Treatment in Children and Adolescents,"1 published in the November 2003 issue of JCP. The reason for this letter is to respond to concerns raised about this paper both during court proceedings and within the lay media. Janssen is a defendant in these legal cases. We are the 2 remaining living authors of this paper who were never employees of Janssen. A third, Thomas Moshang from Children’s Hospital of Philadelphia, has since died.
To begin, at no time during our initial drafting of the paper did we observe any suggestion of inappropriate behavior. The first concerns about the content of this paper came to our attention almost a decade after the paper was published when we learned that the results of specific data analyses were not made available to us during the drafting of this paper.
We take the concerns that have been raised very seriously. Only recently did we obtain both the data sets and information necessary to do the requisite analyses, as well as obtain access to some of the original computer code used for the original analyses. The reanalysis that follows is entirely dependent on the integrity of the data provided to us by Janssen.
As part of this response, an independent statistician was identified—Dr Warren Bilker, who has worked closely with us to address these concerns. Janssen provided Dr Bilker with data sets and additional information about this paper’s original analyses in order to address the issues that have been raised. Janssen funded Dr Bilker’s efforts as part of a Data Access Agreement.
We have taken the following approach: first, we report findings of our independent analyses, which examined whether the results reported in the original paper could be replicated/verified. Second, we address the accusation that the manner in which the data were presented in this paper was misleading. Next, we address the assertion that an important safety signal pertaining to gynecomastia was not communicated to the Journal readership. Subsequently, we address the fact that during the original drafting of this paper, several statistical analyses were performed about which we were not aware until recently (as noted above). As a result of assertions that have been made publicly, we focused our analyses on the relationship between prolactin levels in risperidone-treated youths and the development of gynecomastia.
1. VERIFICATION OF RESULTS
Our independent analyses first examined whether the results reported in the paper could be replicated by Dr Bilker. Dr Bilker was able to review almost all of the data presented in the paper (see below). That is due to the fact that although all of the data from all of the studies involved were provided to Dr Bilker, some of the programs and methodology used to produce a small number of the results in the original paper by an outside consulting company were not available at the time of this reanalysis.
The verification of results is listed in the same order and using the same headings as in the paper.
Results—Patients and Treatment Information
- The statement "There was no statistical difference in gender, age, height, weight, body mass index (BMI), Tanner stage, IQ rating, or DSM-IV Axis II diagnosis of intellectual functioning"1(p1365) was verified with no differences found from the paper.
- The statements about the mean daily dose and mean duration of treatment for the intent-to-treat (ITT), primary analysis (PA), and non-PA populations were not verified due to the programs/methodology not being provided for these results at the time of this reanalysis.
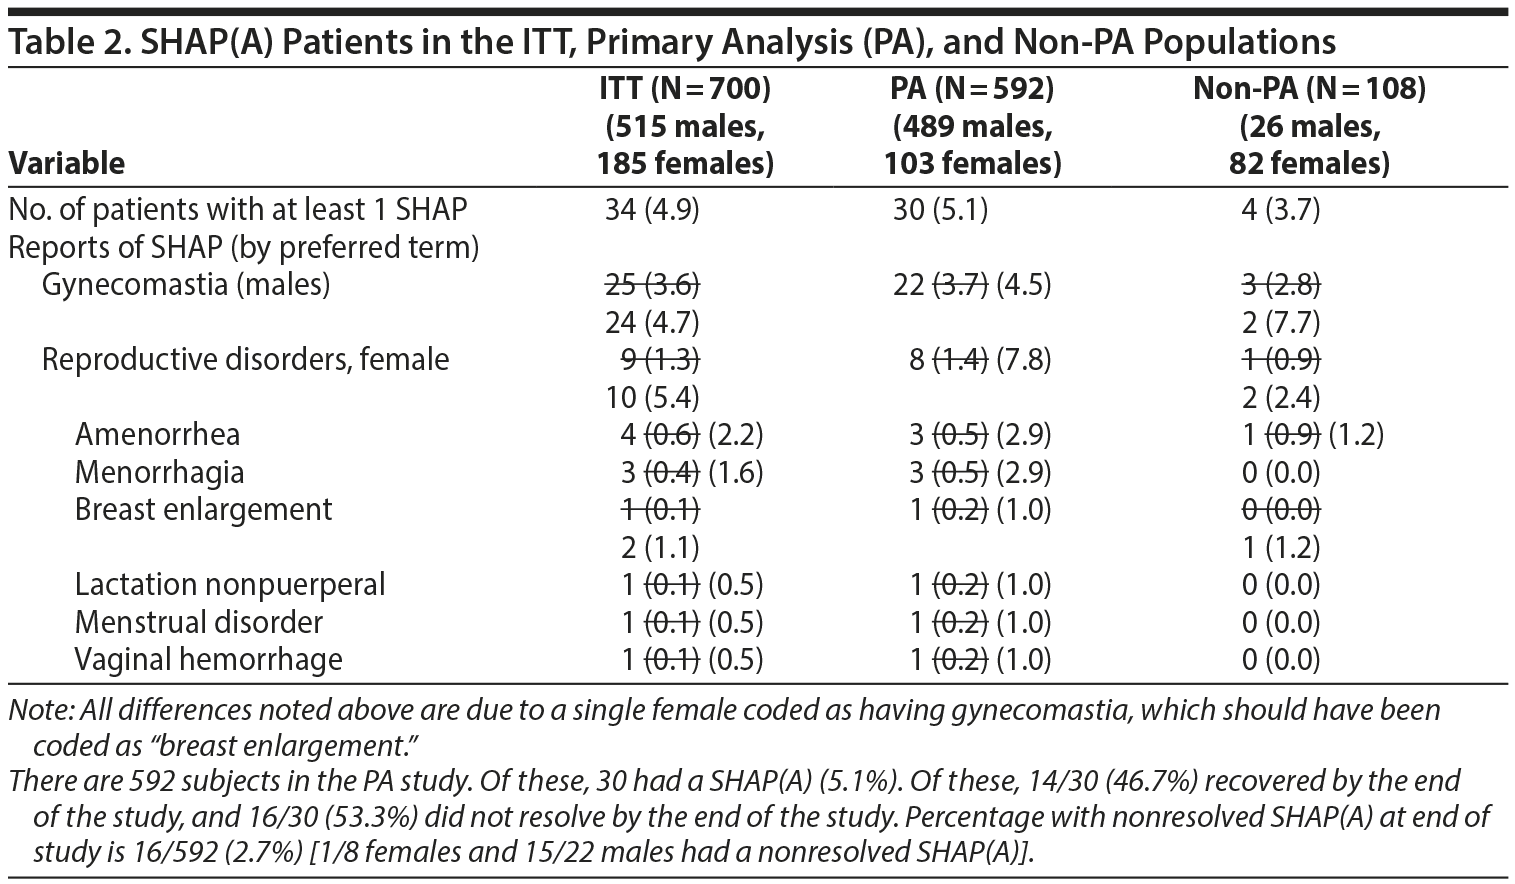
- The last sentence of this section did have a few minor errors. They are noted in the text below using strikethrough for the replaced values.
The PA populations included 489 males (82.6%) and 103 females (17.4%) with CD, oppositional defiant disorder, or DBD-NOS, with or without ADHD. The mean IQ of the patients was 65.1, and mental retardation was considered borderline in 40%, mild in 42%, and moderate in 18%. Patients had a mean age of 9.9 9.4 years, and the majority 73% 83.1% were in Tanner stage 1 of puberty when they began the study. Mean height was 137.8 137.7 cm, mean weight was 35.4 35.3 kg (78.7 77.8 lb), mean BMI was 18.0 18.2, and 80% 80.2% of the patients were white.
Results—Prolactin Levels
- All values in the first 2 paragraphs of this section were verified as correct. The third paragraph could not be verified due to the programs/methodology for discontinuation results not being available at the time of this reanalysis.
- The values presented in the subsections "By Gender," "By Age," and "By Gender and Age" were all verified with no differences found from the paper.
- All values in Table 1 were verified with no differences found from the paper.
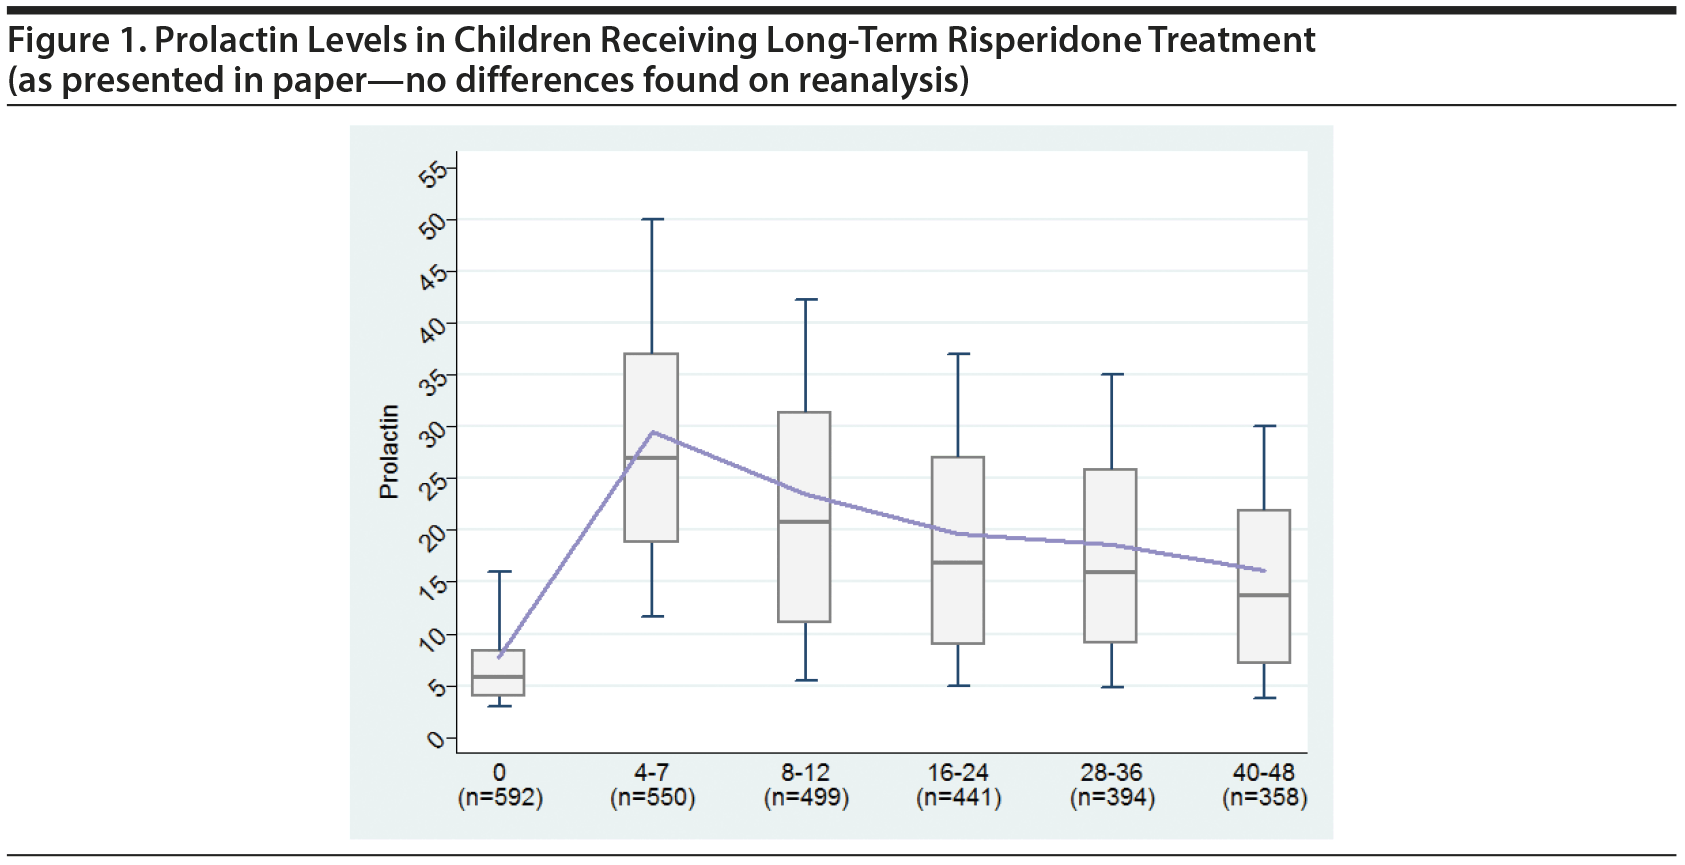
- Figure 1 and all values included in Figure 1 were verified with no differences found from the paper.
Results—Side Effects Hypothetically Attributable to Prolactin [SHAP(A)]
- Table 2. A single female patient was incorrectly identified as having gynecomastia. However, if this female is recategorized as having an adverse event of breast enlargement, several changes occur in Table 2. The changes are noted below with strikethrough text. The denominators used for male- and female-specific disorders in the paper were the full sample sizes and have been modified below to be the number of males or females, respectively. Additional information about SHAP(A) recovery is provided at the bottom of Table 2.
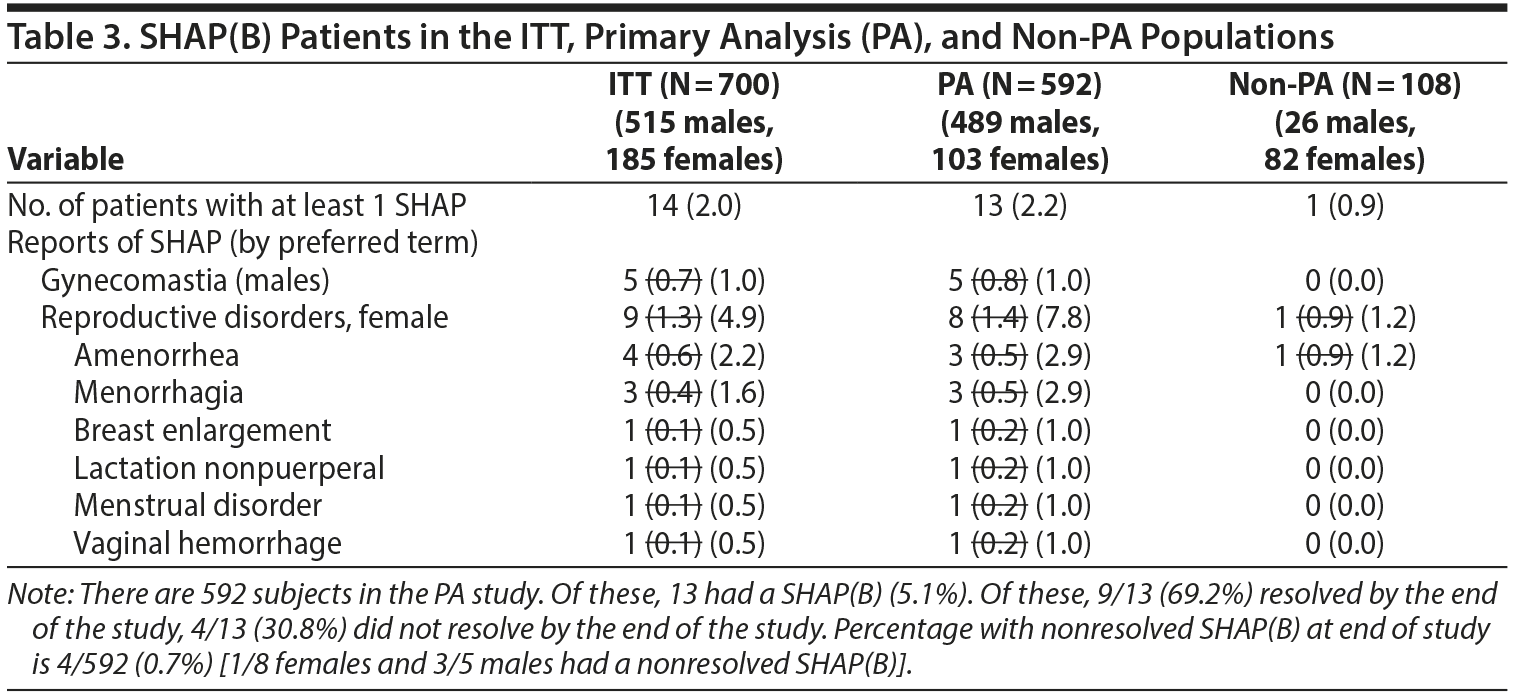
- Table 3. No differences were found in the number of events shown in Table 3 on reanalysis. However, the denominators used for male- and female-specific disorders in the paper were the full sample sizes and have been modified be to be the number of males or females, respectively (see next section of letter for modified table).
- All values in the text from below Table 3 to the bottom of the left column on page 1367 were verified as correct.
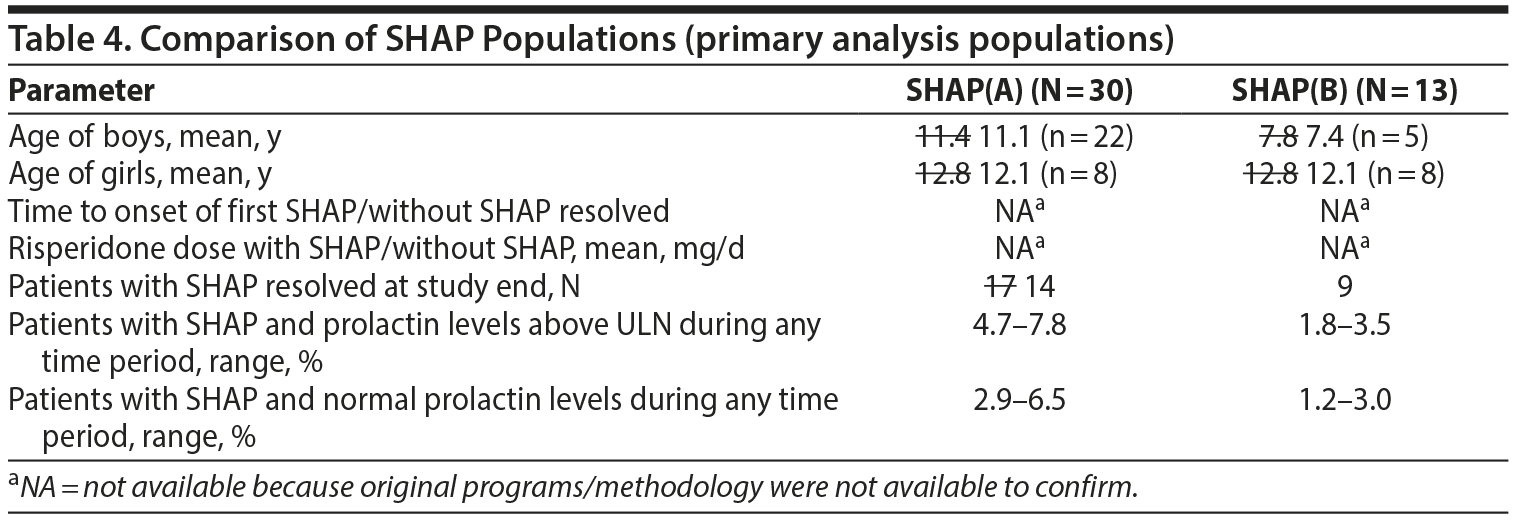
- Table 4. There were some differences identified in Table 4. They are noted in the table below with strikethrough of the modified values from verification. The values marked with an asterisk could not be verified with the data provided to us.
- The values in the text below Table 4, page 1367 right side, through the end of the paragraph ending with "Further SHAP results refer to the SHAP(B) analysis" were all verified as correct.
- The paragraph beginning with "The mean (SD) daily dose of risperidone" could not be verified with the available data and documentation of the dose analysis programs.
- The paragraph beginning with "A total of 15 SHAP were reported" was verified as correct.
- In the next paragraph, there was 1 discrepancy, as noted with a strikethrough: "Only 1 of the patients with these prolactin levels, a 12.5 12.0-year-old female, had SHAP."
Results—Prolactin Levels and Extrapyramidal Symptoms (EPS)
In the next paragraph, the underlined text could not be verified with available data.
"Altogether, 129/592 patients in the PA population (21.8%) reported at least 1 EPS versus 18/108 (16.7%) in the non-PA population. The mean (SD) onset of the first EPS was 64.3 (99.3) days in the PA population and 40.6 (69.6) days in the non-PA population. There was no significant difference in the percentage of patients who experienced EPS with mean prolactin levels in the normal range (21.0%-24.5%) versus those at or above the upper limit of normal (ULN) (20.9%-24.3% 27.6%)."
Results—Prolactin Levels and Score on the Conduct Problem Subscale of the N-CBRF
It was reported that there was no significant correlation between prolactin levels and the improvement on the conduct problem subscale of the N-CBRF (correlations ranged from 0.10 to 0.02). These correlations appear to be taken from untransformed values of N-CBRF and prolactin levels, which yield correlations in the range −0.09 to −0.02. However, it is the change in N-CBRF, rather than the absolute N-CBRF, that is needed to consider improvement. The percent change in N-CBRF from baseline is highly left skewed, and thus Spearman correlations were applied. The Spearman correlations of the percent change in N-CBRF from baseline with prolactin levels over the time periods considered range from 0.03 to 0.09, with no significant correlations.
Results—Prolactin Levels and Risperidone Dose
Could not be verified due to programs and methodology not being available at the time of this reanalysis.
From the data available to us for review, the changes/errata noted do not change the conclusions or interpretation of the original paper. In the spirit of transparency, we believe these new findings, although they are both modest and do not alter our interpretation of the study, should be communicated to readers. Based on the data provided to us from Janssen, we believe that no other revisions to our paper are indicated. Furthermore, as we have found no evidence of falsification, we do not believe this paper should be retracted from the medical literature.
2. MALES-ONLY ANALYSES
Since concerns have been raised specifically about our having combined the males and females in the original analysis, we believe it is important to present separate analyses for males.
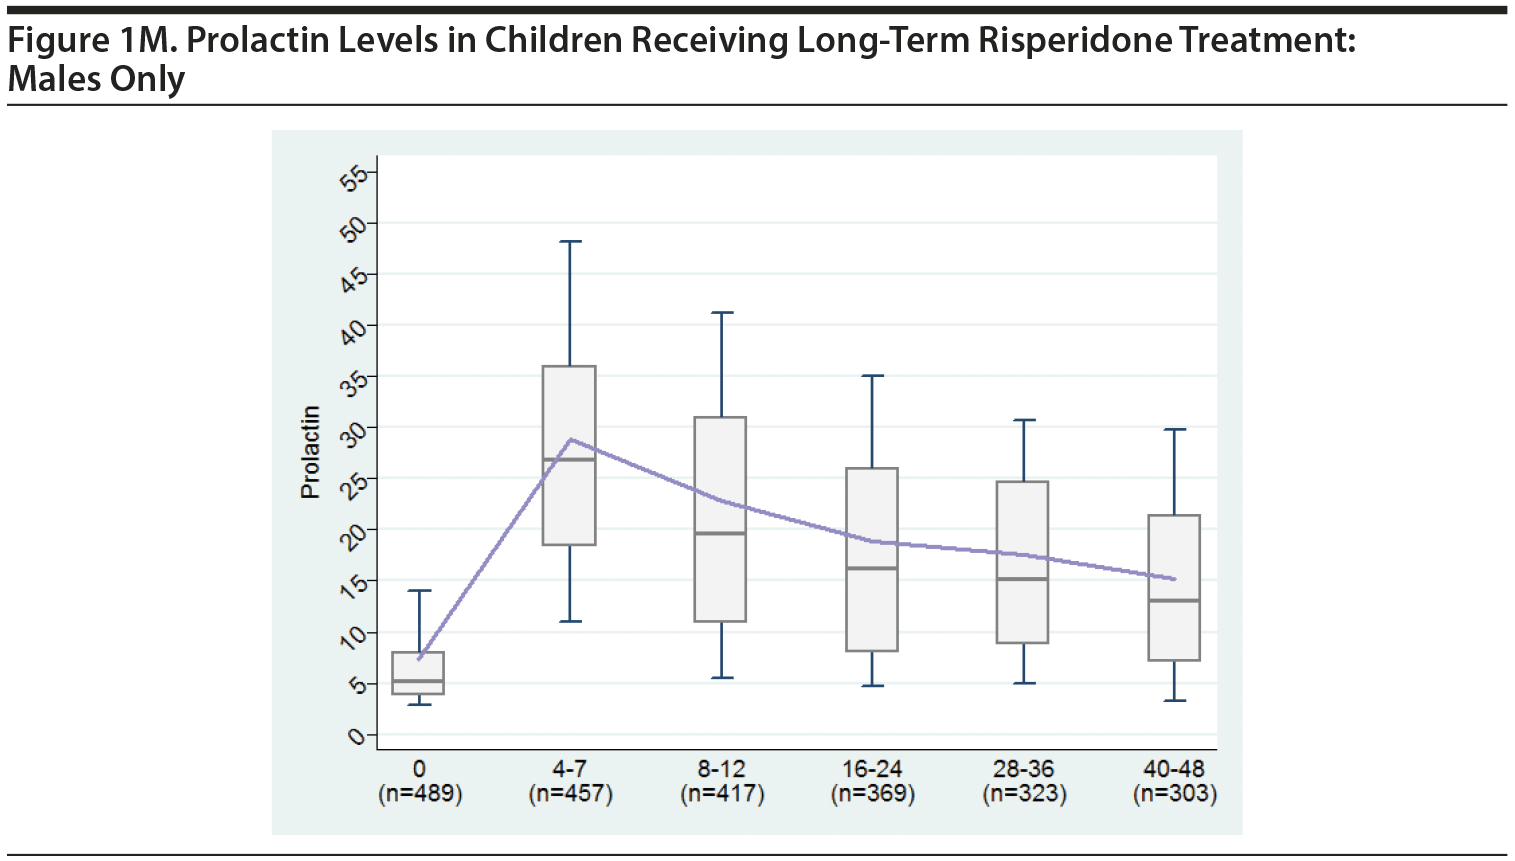
Tables and a figure that include only male participants are listed next.
No differences were found in the number of events shown in Table 3 on reanalysis. However, the denominators used for male- and female-specific disorders in the paper were the full sample sizes and have been modified below to be the number of males or females, respectively.
We hope presenting these additional males-only tables provides greater clarity to the Journal‘s readership.
3. additional GYNECOMASTIA data
The greatest concern to us was the assertion that there was an important safety signal about the risk of gynecomastia in males within the extant data that was not reported in this paper. We believe the additional males-only data that we have reported above address, in part, these concerns.
It should be noted that the original paper did not focus primarily on the issue of gynecomastia. For that reason, we did not focus on that specific issue in the original paper. However, due to the concerns noted during legal proceedings regarding the relationship between risperidone and gynecomastia, we further examined the data provided to us relating to gynecomastia.
First, we considered how often patients were discontinued from these clinical trials due to adverse events. We noted that 7 patients discontinued due to an adverse event. All of these 7 patients discontinued due to gynecomastia that was considered to be "moderate" in severity. These 7 patients were all participants in the international study (referred to as INT in the original paper).
Of particular concern to us was the severe and disfiguring gynecomastia that has been reported in the media. From the data provided to us, no participants had gynecomastia rated as being "severe." All reported gynecomastia events were either mild or moderate.
4. reevaluation of unpublished analyses: Prolactin and Side effects
During these legal proceedings, we learned that several statistical analyses were conducted about which we were not aware at the time the original paper was published. Concerns that have been raised in legal proceedings and the media have focused on 2 series of analyses.
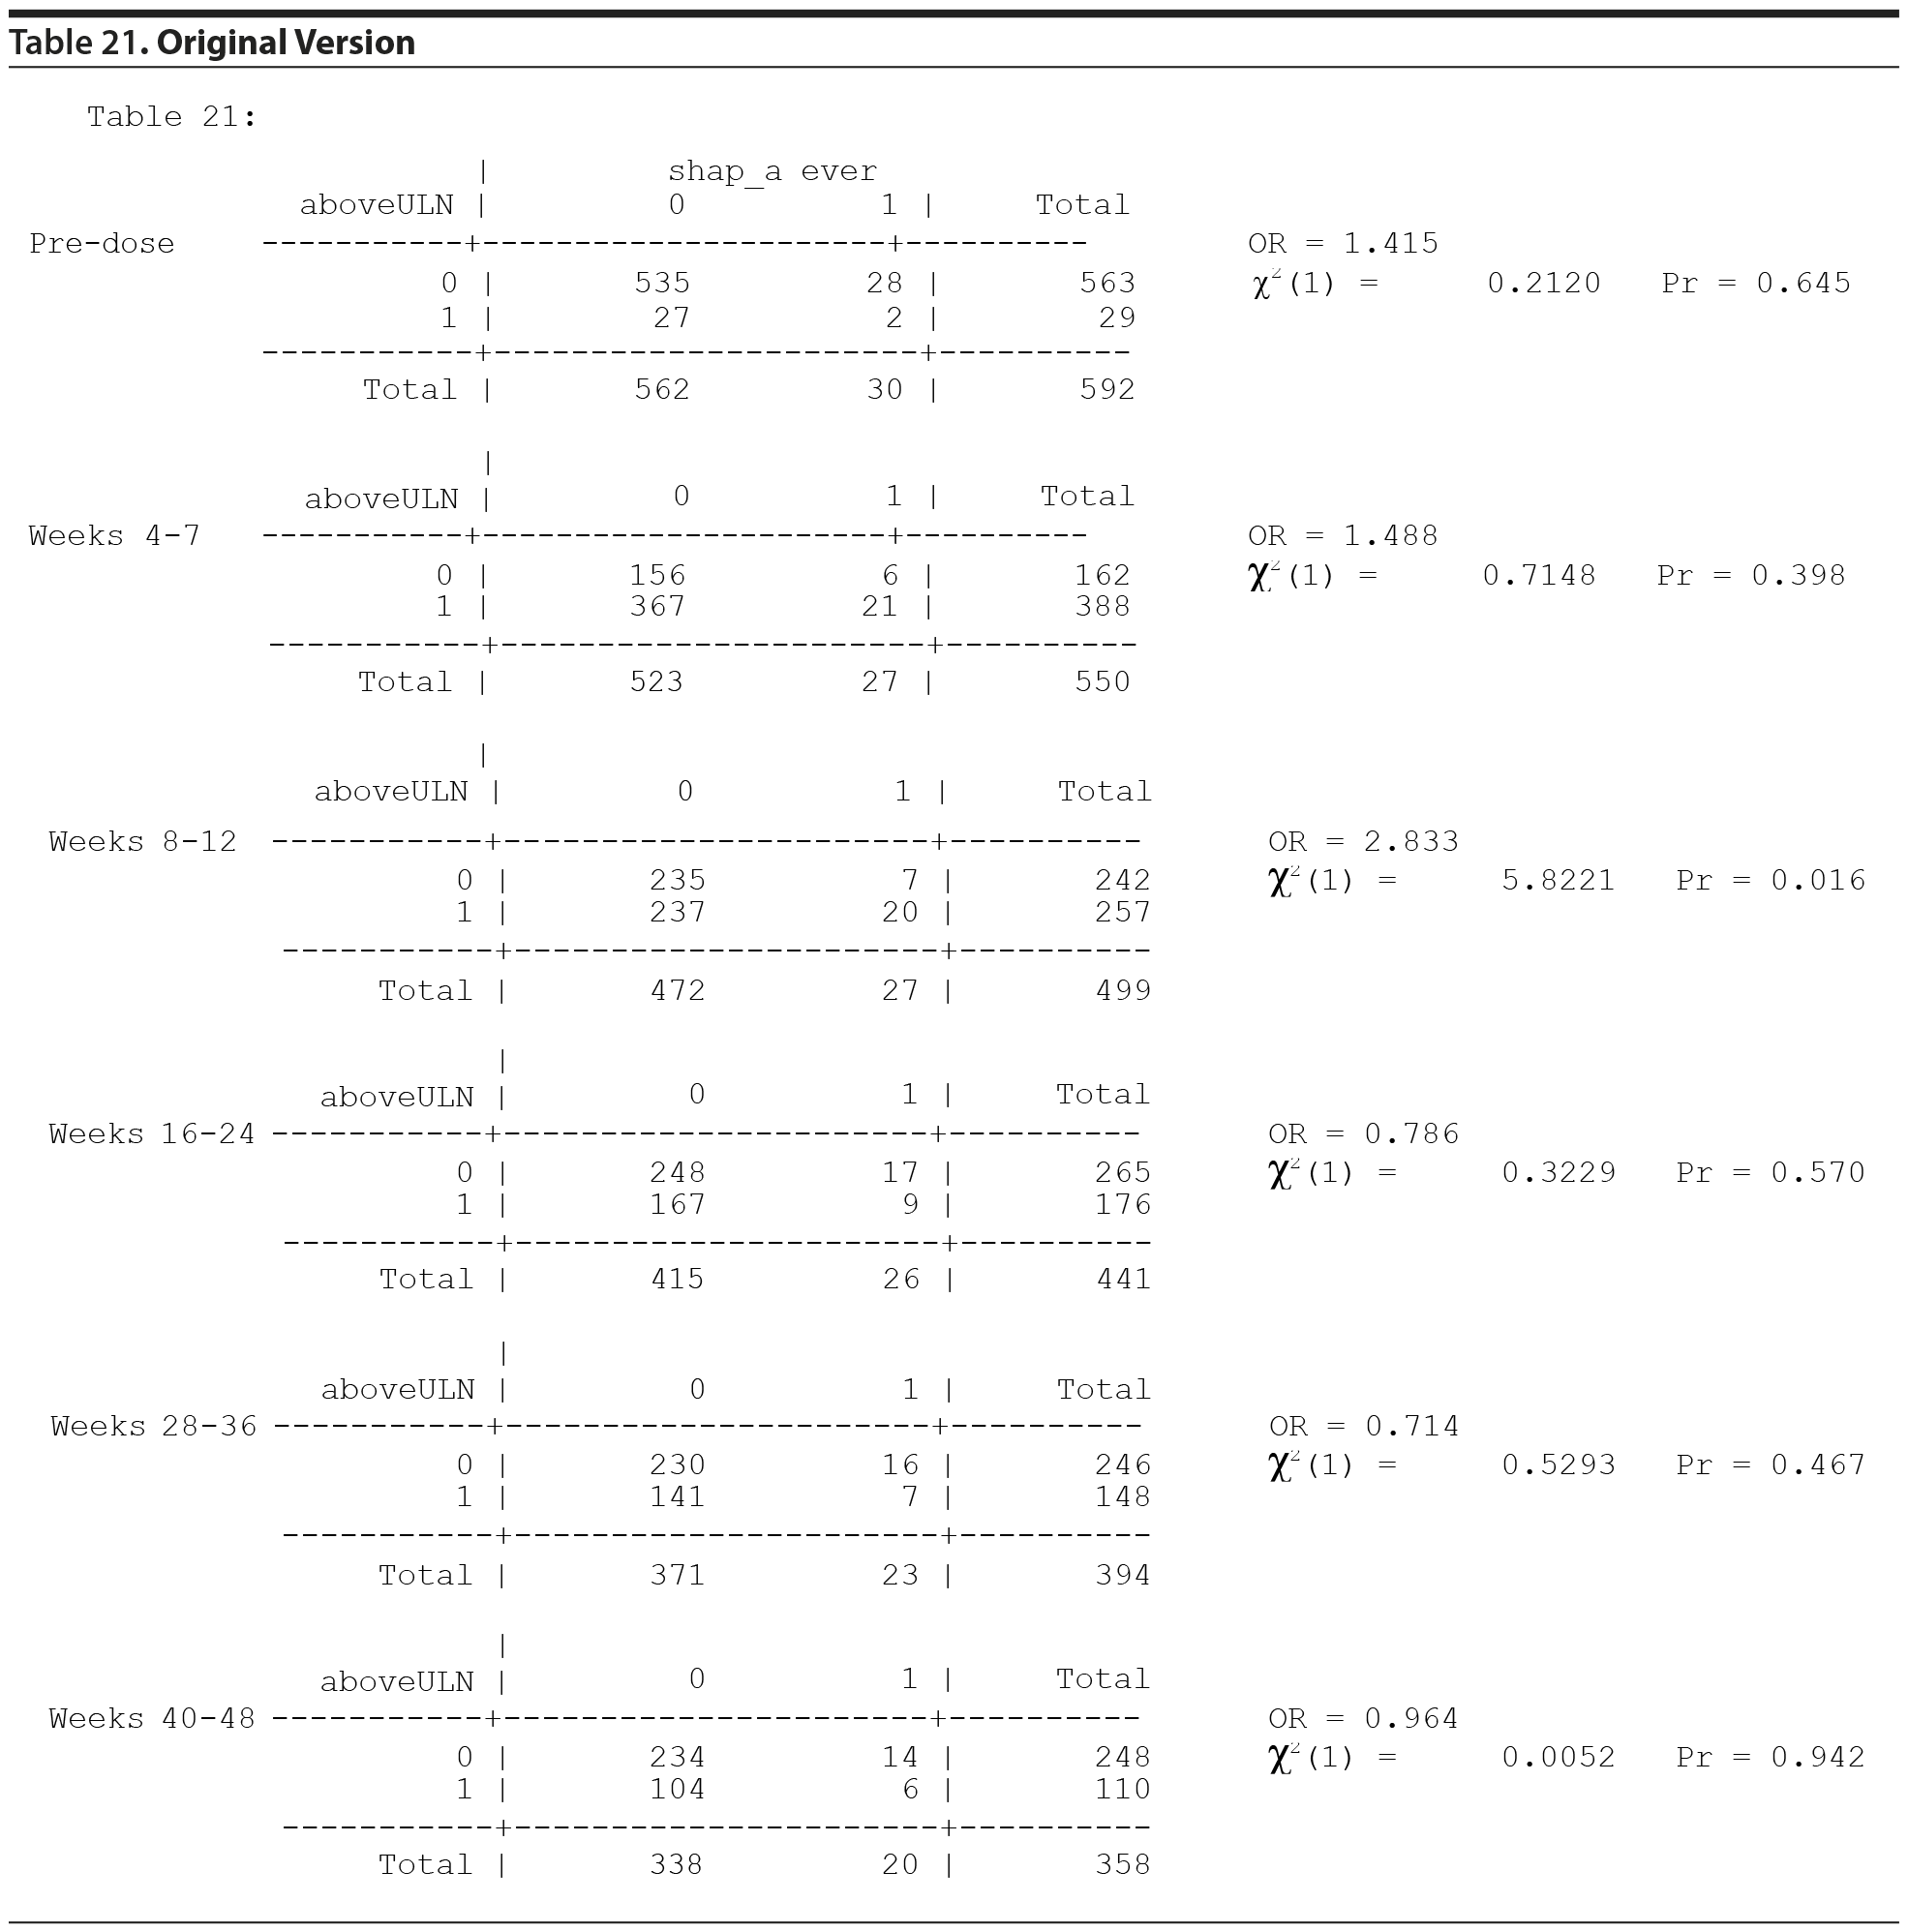
The first, which has been referred to as "Table 21," was a series of analyses that examined the relationship between a patient’s having a prolactin level above the upper limit of normal (ULN) at a specific time point and the presence of side effects hypothetically attributable to prolactin (SHAP[A]) for that specific patient at any time point during the course of study participation. These concerns pertain to whether or not gynecomastia occurring in children and youth treated with risperidone is related to the risperidone-induced changes in prolactin concentrations.
Original Analyses of Table 21
From the data provided to us recently, the analysis originally done for Table 21 used 6 separate 2 ×— 2 tables and provided a P value for each table for the association between prolactin concentrations "above ULN" at the specific time period and the presence of a SHAP(A) at any time period. The typical procedure for testing the association across the 6 tables is to first test the homogeneity of the odds ratios (ORs) across the 6 tables, using a Mantel-Haenszel (MH) like test of homogeneity. If the ORs are heterogeneous, then the 6 tables are examined separately. Since there are 6 P values, 1 for each table, a multiple comparisons adjustment must be made to adjust for the inflated type I error rate.
The MH test assumes that the 6 groups used to form the 6 tables are independent, an assumption that is not valid in this case, since the majority of subjects have observations for multiple time periods and thus contribute to multiple tables. A Mantel-Haenszel like test of homogeneity of the ORs accommodating this clustering of observations was obtained using the logistic regression form of the MH test and applying a Huber-White variance adjustment, a model including "above ULN," time period, and the interaction of these variables. A test for the significance of the interaction provides a cluster adjusted extension of the homogeneity test. The extension of the test of H0: OR = 1 that accommodates the clustered observations developed by Begg2 and implemented in SAS by Begg and Paykin3 was used to obtain the correct test for this hypothesis.
All values in the original Table 21, which appears below, were verified as correct.
The MH test of homogeneity of the ORs, accommodating the clustering, is not rejected (χ2(5) = 10.67, P = .0582). The MH combined OR is 1.218, and the hypothesis that the MH combined OR is equal to 1 is not rejected (cluster adjusted χ2(1) = 0.6120, P = .4340). Thus, it cannot be stated that any of the ORs across the 6 time periods are different from one another or that the overall (combined) OR is different from 1.
No testing would generally be done on the individual tables for the individual periods due to the above findings. However, the individual table P values for association were considered, as reported in Table 21, even though the MH test indicated homogeneity of the ORs.
In such instances, adjustments for multiple comparisons should be applied. There are a variety of possible multiple comparisons adjustments. To assure that the multiple comparisons adjustments were not driven by which test was selected, 7 different tests were applied: Bonferroni, stepdown Bonferroni, Sidak, stepdown Sidak, Hochberg, false discovery rate, and Benjamini-Hochberg-Yekutieli. The results of the Hochberg, false discovery rate, and Benjamini-Hochberg-Yekutieli procedures are presented. However, in no case did the conclusion differ for other procedures.
Thus, considering the 6 individual tables, after adjustment for multiple comparisons, there are no significant differences in the risk of SHAP(A) for those above the ULN versus those not above the ULN in any of the 6 time periods.
Analyses With Males Only—Focus on Gynecomastia
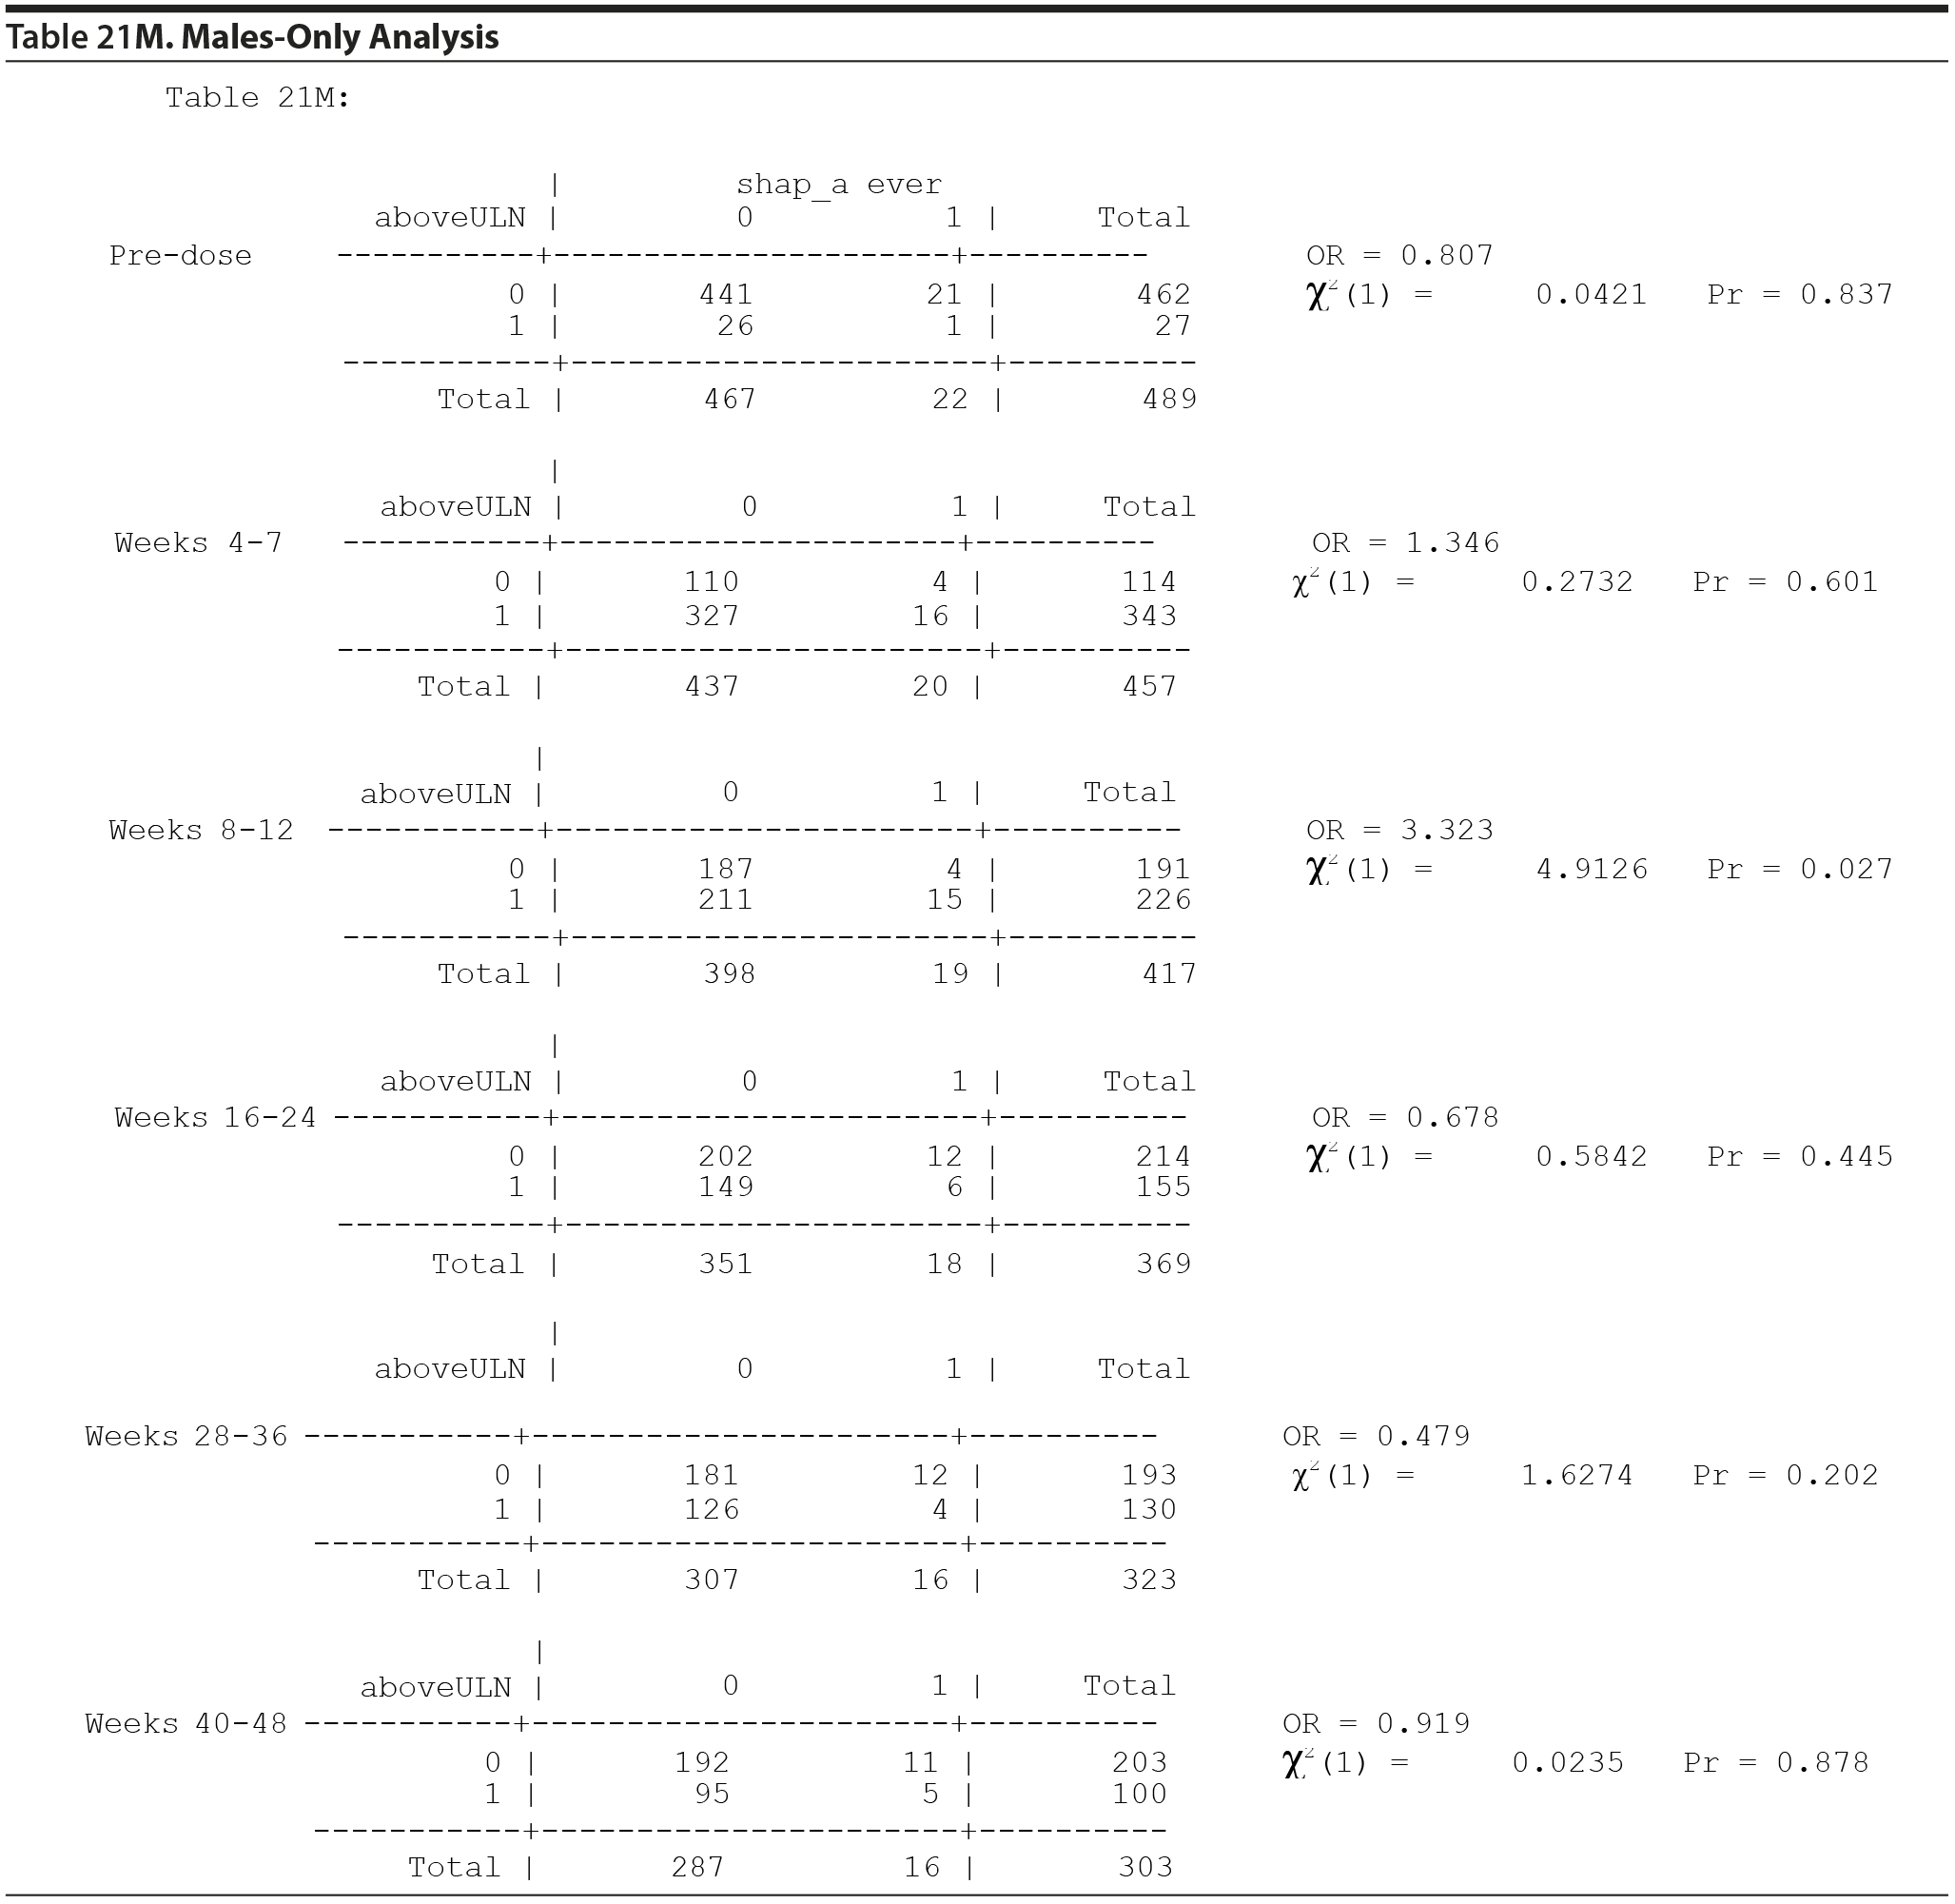
Table 21 included both males and females. It is helpful to consider a males-only version of Table 21. Table 21M specifically considers the gynecomastia adverse event in males only.
The MH test of homogeneity of the ORs is rejected (χ2(5) = 14.35, P = .0135). This indicates that for at least 1 pair of tables the association between "above ULN" at the specific time period and the presence of a SHAP(A) at any time period is different, as measured by the OR, but not necessarily that any of the ORs are different from 1. The ORs range from 0.479 to 3.323. Since statistically significant heterogeneity of the odds ratios was detected, the MH combined OR is not presented. It is helpful to consider the individual table odds ratios and P values.
There are 6 P values in the above analysis for Table 21M. The same multiple comparisons procedures were applied as in Table 21.
Thus, even if one were to consider testing the 6 individual tables, after adjustment for multiple comparisons, there are no significant differences in the risk of gynecomastia for those above the ULN versus those not above the ULN in any of the 6 time periods.
Longitudinal Approach
Table 21 considers what are really longitudinal measurements of prolactin level and SHAP(A) in 6 separate cross-sectional analyses. A more informative approach to assessing the prolactin data is to consider longitudinal graphics and analysis of the relationship between prolactin levels over time and their effect on SHAP(A) presentation over time.
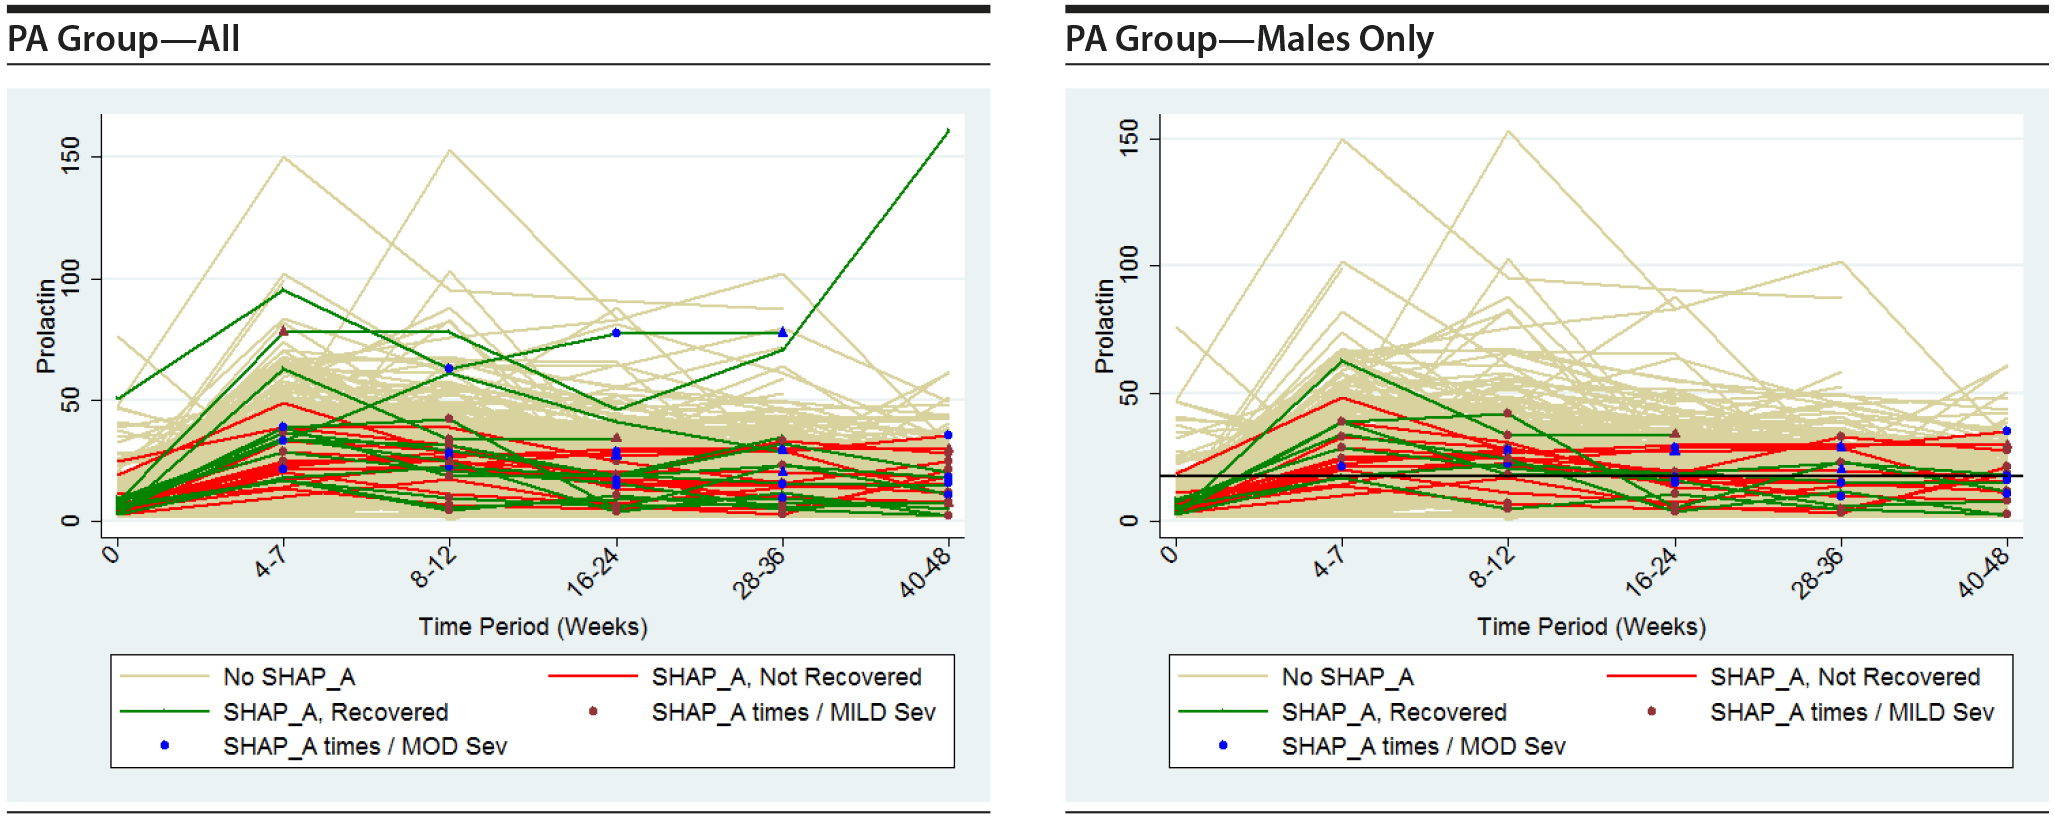
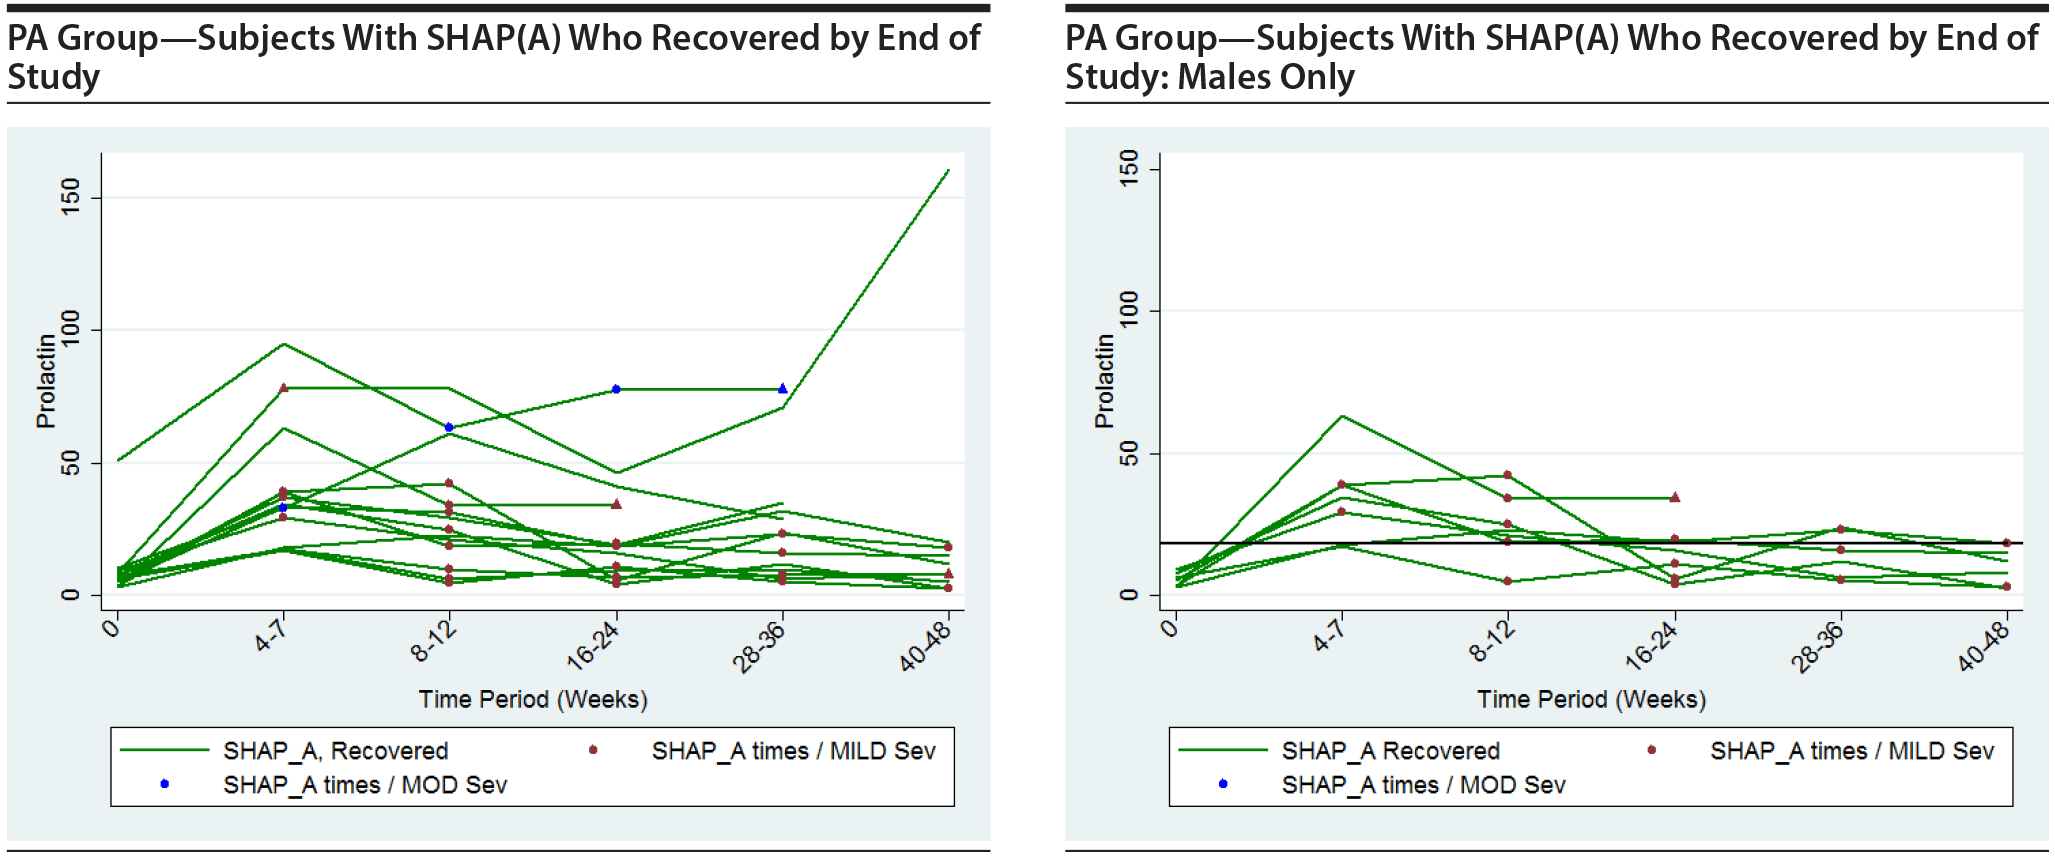
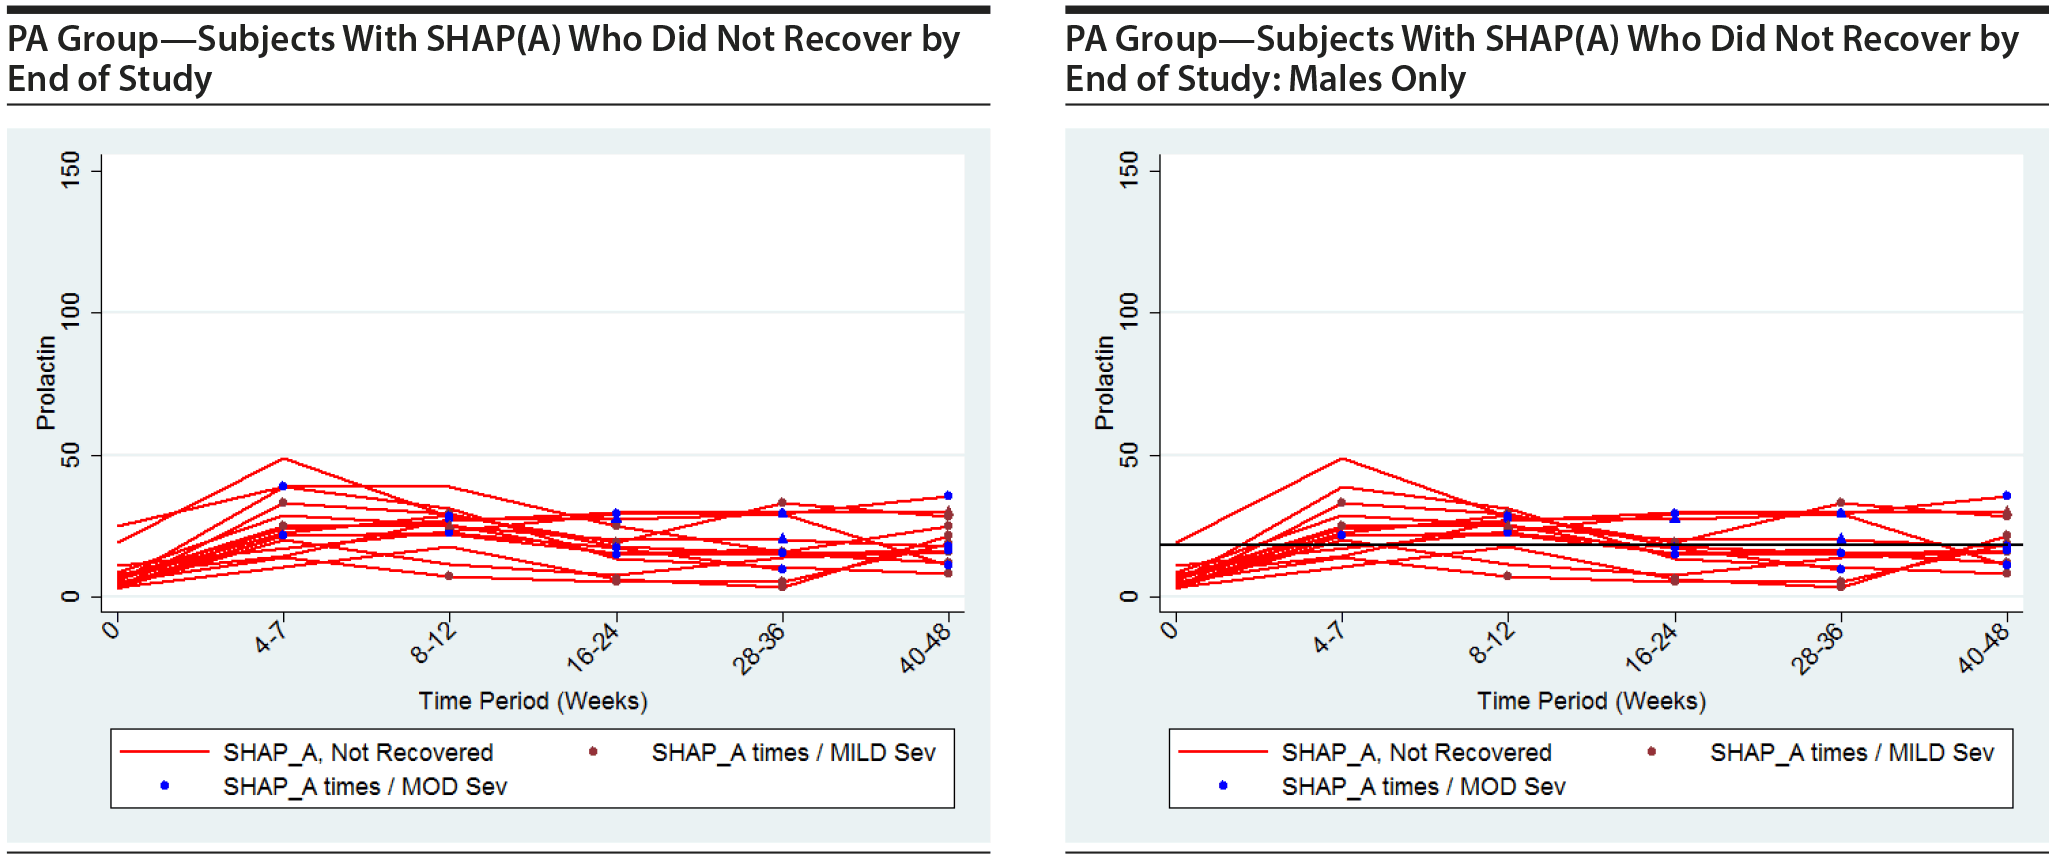
The following plots show the values of prolactin at each time measured for each subject in the group being represented in each plot. There is a separate connected line for each subject. The lines are color coded, with gold used for each subject that was never diagnosed with a SHAP(A) during the course of the study, green used for each subject that had at least 1 SHAP(A) diagnosis but had recovered from the SHAP(A) by the end of the study follow-up period, and red used for each subject that had at least 1 SHAP(A) diagnosis and had not recovered from the SHAP(A) by the end of the study follow-up period. Each prolactin level for a subject that was associated with a SHAP(A) diagnosis is denoted by either a blue or red marker. A red marker denotes a SHAP(A) of mild severity, while a blue marker denotes a SHAP(A) of moderate severity. Note that there were no SHAP(A)s that were of severe severity. There were a small number of SHAP(A)s at specific time periods for which no prolactin measurements were available. Values for prolactin were imputed in these cases to facilitate placing markers on the plots to represent these SHAP(A) diagnoses. A circle marker was used for actual values, while a triangle marker was used for imputed values. In cases in which imputed values were used, the higher of the prolactin values before and after the missing prolactin value was used. Plots are presented for the PA here, but were also completed for the ITT and non-PA groups. Plots are provided with the following sets of subjects: "all," "subjects with SHAP(A) who recovered by end of study," and "subjects with SHAP(A) who did not recover by end of study." These 4 plots are then repeated considering males only. For the males-only plots, a horizontal line at a prolactin level of 18 ng/mL, the ULN for males, is included.
It is seen that the subjects with SHAP(A) do not appear to have patterns of prolactin levels that are higher than those of subjects that did not have a SHAP(A). The same is true of the males-only longitudinal plots.
Longitudinal Data Analysis
The Table 21 analysis considered SHAP(A) at any time period as the outcome, rather than SHAP(A) at each time period separately. Additionally, in the Table 21 analysis, the prolactin measurement was binary—above ULN, yes or no—rather than considering the continuous prolactin level. A more informative analysis of the data is to consider the continuous prolactin level and SHAP(A) (yes/no) for each time period for every subject. Thus, each subject can contribute up to 6 observations, 1 for each time period. The multiple observations per subject are nonindependent, and this feature of the data is accommodated in the logistic regressions used to model the data (cluster option for logistic regression in STATA 14, which applies the Huber-White adjustment).
First, consider all subjects from the PA population. Note that the "pre-dose" time period was excluded from the models since there were no SHAP(A)s during this time period, leaving 5 time periods. The "weeks 4-7" period was considered the baseline period in the models. First, consider a model with prolactin level (continuous), time period (5-level factor), and the prolactin-by-time period interaction. The interaction was not significant (P = .7083) and thus was dropped. The model including prolactin level (continuous) and time period (5-level factor) had a significant global (Wald) test for time period (P = .033), while prolactin level was not significant (P = .344). The final model considered is thus a model including prolactin level and time period.
| Covariate | OR | P Value | Lower 95% CI | Upper 95% CI |
| Prolactin | 1.009 | .344 | 0.991 | 1.027 |
| Weeks 4-7 (baseline) | 1.000 | ‘ ¦ | ‘ ¦ | ‘ ¦ |
| Weeks 8-12 | 2.098 | .047 | 1.009 | 4.365 |
| Weeks 16-24 | 2.625 | .011 | 1.248 | 5.524 |
| Weeks 28-36 | 2.427 | .039 | 1.048 | 5.623 |
| Weeks 40-48 | 2.952 | .007 | 1.353 | 6.442 |
| Time period (global test) | .033 |
Since this appears to show an increasing trend in the risk of SHAP(A) across time periods, models were fit to assess this trend. In the following models, both prolactin and time period were considered continuous to test the trend over time period. First, a model including prolactin level (continuous), time period (continuous, 1-5), and the prolactin-by-time period interaction was fit. The interaction was not significant (P = .999), and thus it was dropped. The model, shown below, including prolactin level and time period had a significant time period effect (P = .008) and no prolactin level effect (P = .402). Thus, the risk of SHAP(A) appears not to be related to prolactin, but rather to time period, with an increased rate over time periods. This may be due to a detection bias or possibly increased obesity over time or some other factor(s).
| Covariate | OR | P Value | Lower 95% CI | Upper 95% CI |
| Prolactin | 1.008 | .402 | 0.990 | 1.026 |
| Time period | 1.234 | .008 | 1.056 | 1.441 |
Next, consider repeating the above analyses with males only from the PA population. First, consider a model with prolactin level (continuous), time period (5-level factor), and the prolactin-by-time period interaction. The interaction was not significant (P = .493) and thus was dropped. The model including prolactin level (continuous) and time period (5-level factor) had a significant global (Wald) test for time period (P = .037), while prolactin level was not significant (P = .856). The final model considered is thus a model including prolactin level and time period.
| Covariate | OR | P Value | Lower 95% CI | Upper 95% CI |
| Prolactin | 1.002 | .856 | 0.983 | 1.020 |
| Weeks 4-7 (baseline) | 1.000 | ‘ ¦ | ‘ ¦ | ‘ ¦ |
| Weeks 8-12 | 2.699 | .022 | 1.153 | 6.319 |
| Weeks 16-24 | 2.339 | .011 | 1.317 | 8.464 |
| Weeks 28-36 | 3.229 | .033 | 1.098 | 9.490 |
| Weeks 40-48 | 4.134 | .006 | 1.505 | 11.362 |
| Time period (global test) | .037 |
Since this appears to show an increasing trend over time period, models were fit to assess this possibility. In the following models, both prolactin and time period were considered continuous to test the trend over time period. First, a model including prolactin level (continuous), time period (continuous, 1-5), and the prolactin-by-time period interaction was fit. The interaction was not significant (P = .275), and thus it was dropped. The model, shown below, including prolactin level and time period had a significant time period effect (P = .008) and no prolactin level effect (P = .965). Thus, the risk of SHAP(A) for males only appears not to be related to prolactin, but rather to be related to time period with an increased rate over time periods. This may be due to a detection bias or possibly increased obesity over time or some other factor(s).
| Covariate | OR | P Value | Lower 95% CI | Upper 95% CI |
| Prolactin | 1.0004 | .965 | 0.981 | 1.020 |
| Time period | 1.291 | .008 | 1.070 | 1.557 |
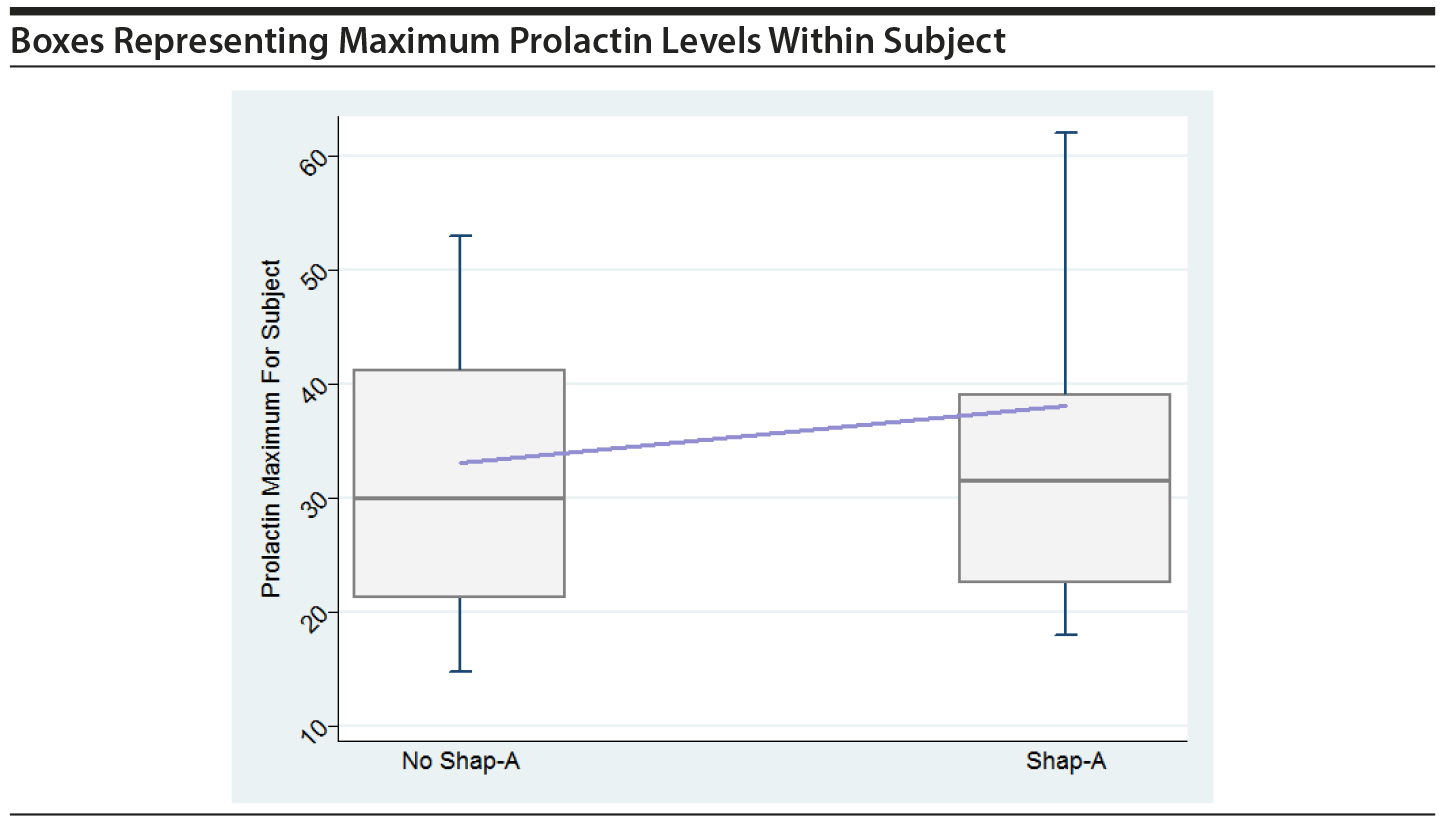
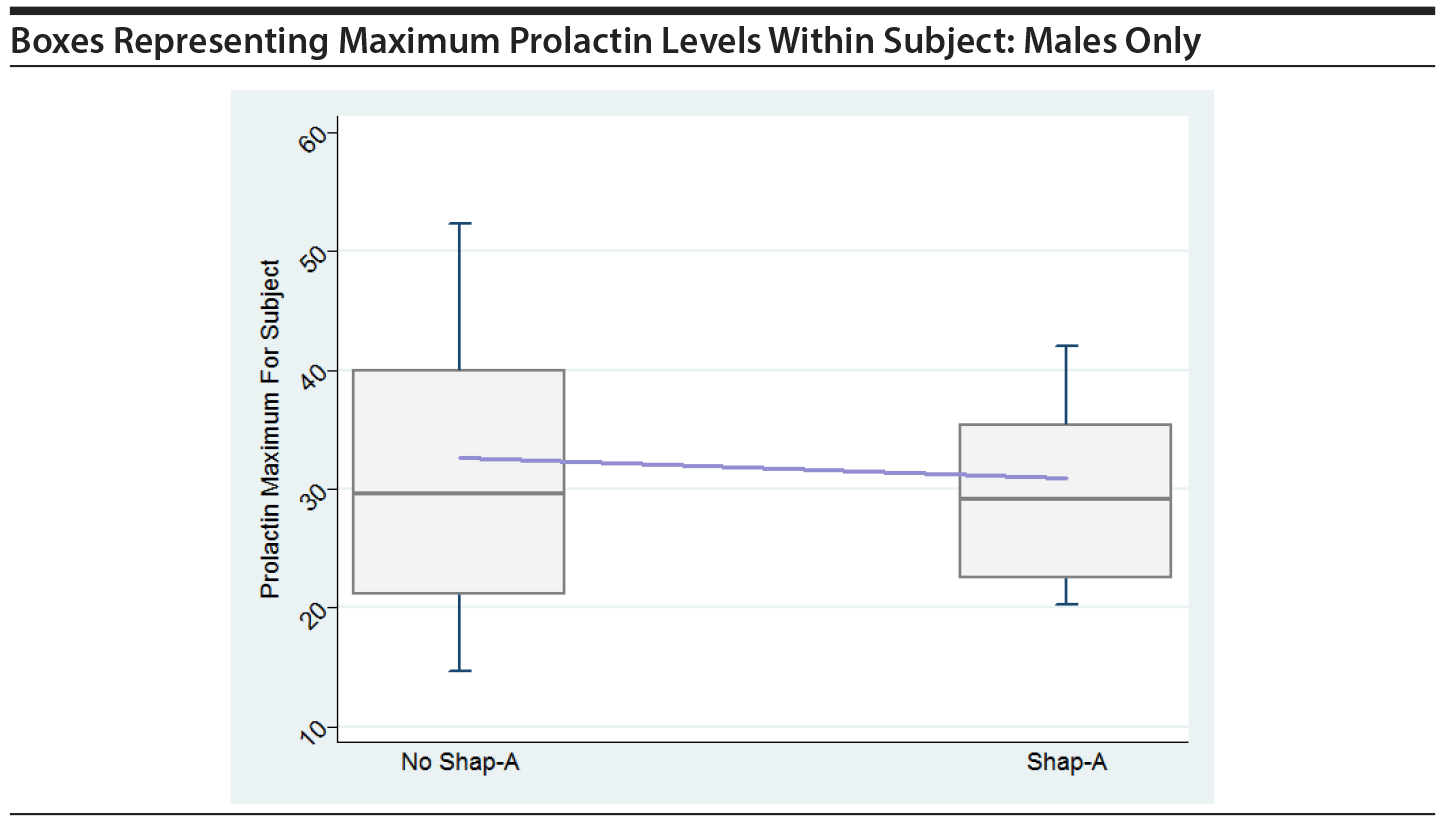
In order to graphically assess the impact of large prolactin values on the risk of SHAP(A), boxes were created, similar to Figure 1 in the original paper. The boxes show maximum prolactin levels across all time periods within subject, separately for those that had a SHAP(A) event at any time and those that did not have a SHAP(A) event. The horizontal line within the box represents the median across all subjects of the subject-specific maximum prolactin level. The line that connects the boxes connects the mean of the maximum prolactin levels. Boxes are shown for all in PA and for males only in PA.
These plots do not indicate that the maximum prolactin values for each subject play a key role in their having a SHAP(A), either overall or for males only.
To summarize, when prolactin levels and SHAP(A) are examined using multiple techniques, we were not able to find a relationship between the magnitude of prolactin concentrations and SHAP(A) in general and gynecomastia in particular. It is possible that the gynecomastia observed in these individuals may have been due to weight gain and the resulting enhanced androgen-to-estrogen conversion in the increased body fat4,5 or some other unknown determinant(s).
5. reevaluation of unpublished analyses: Prolactin and behavioral response
The other set of analyses about which concerns were raised has been referred to in legal proceedings as "Table 34." As with "Table 21," we were not aware of this table’s existence at the time the original paper was published.
Table 34 Analyses
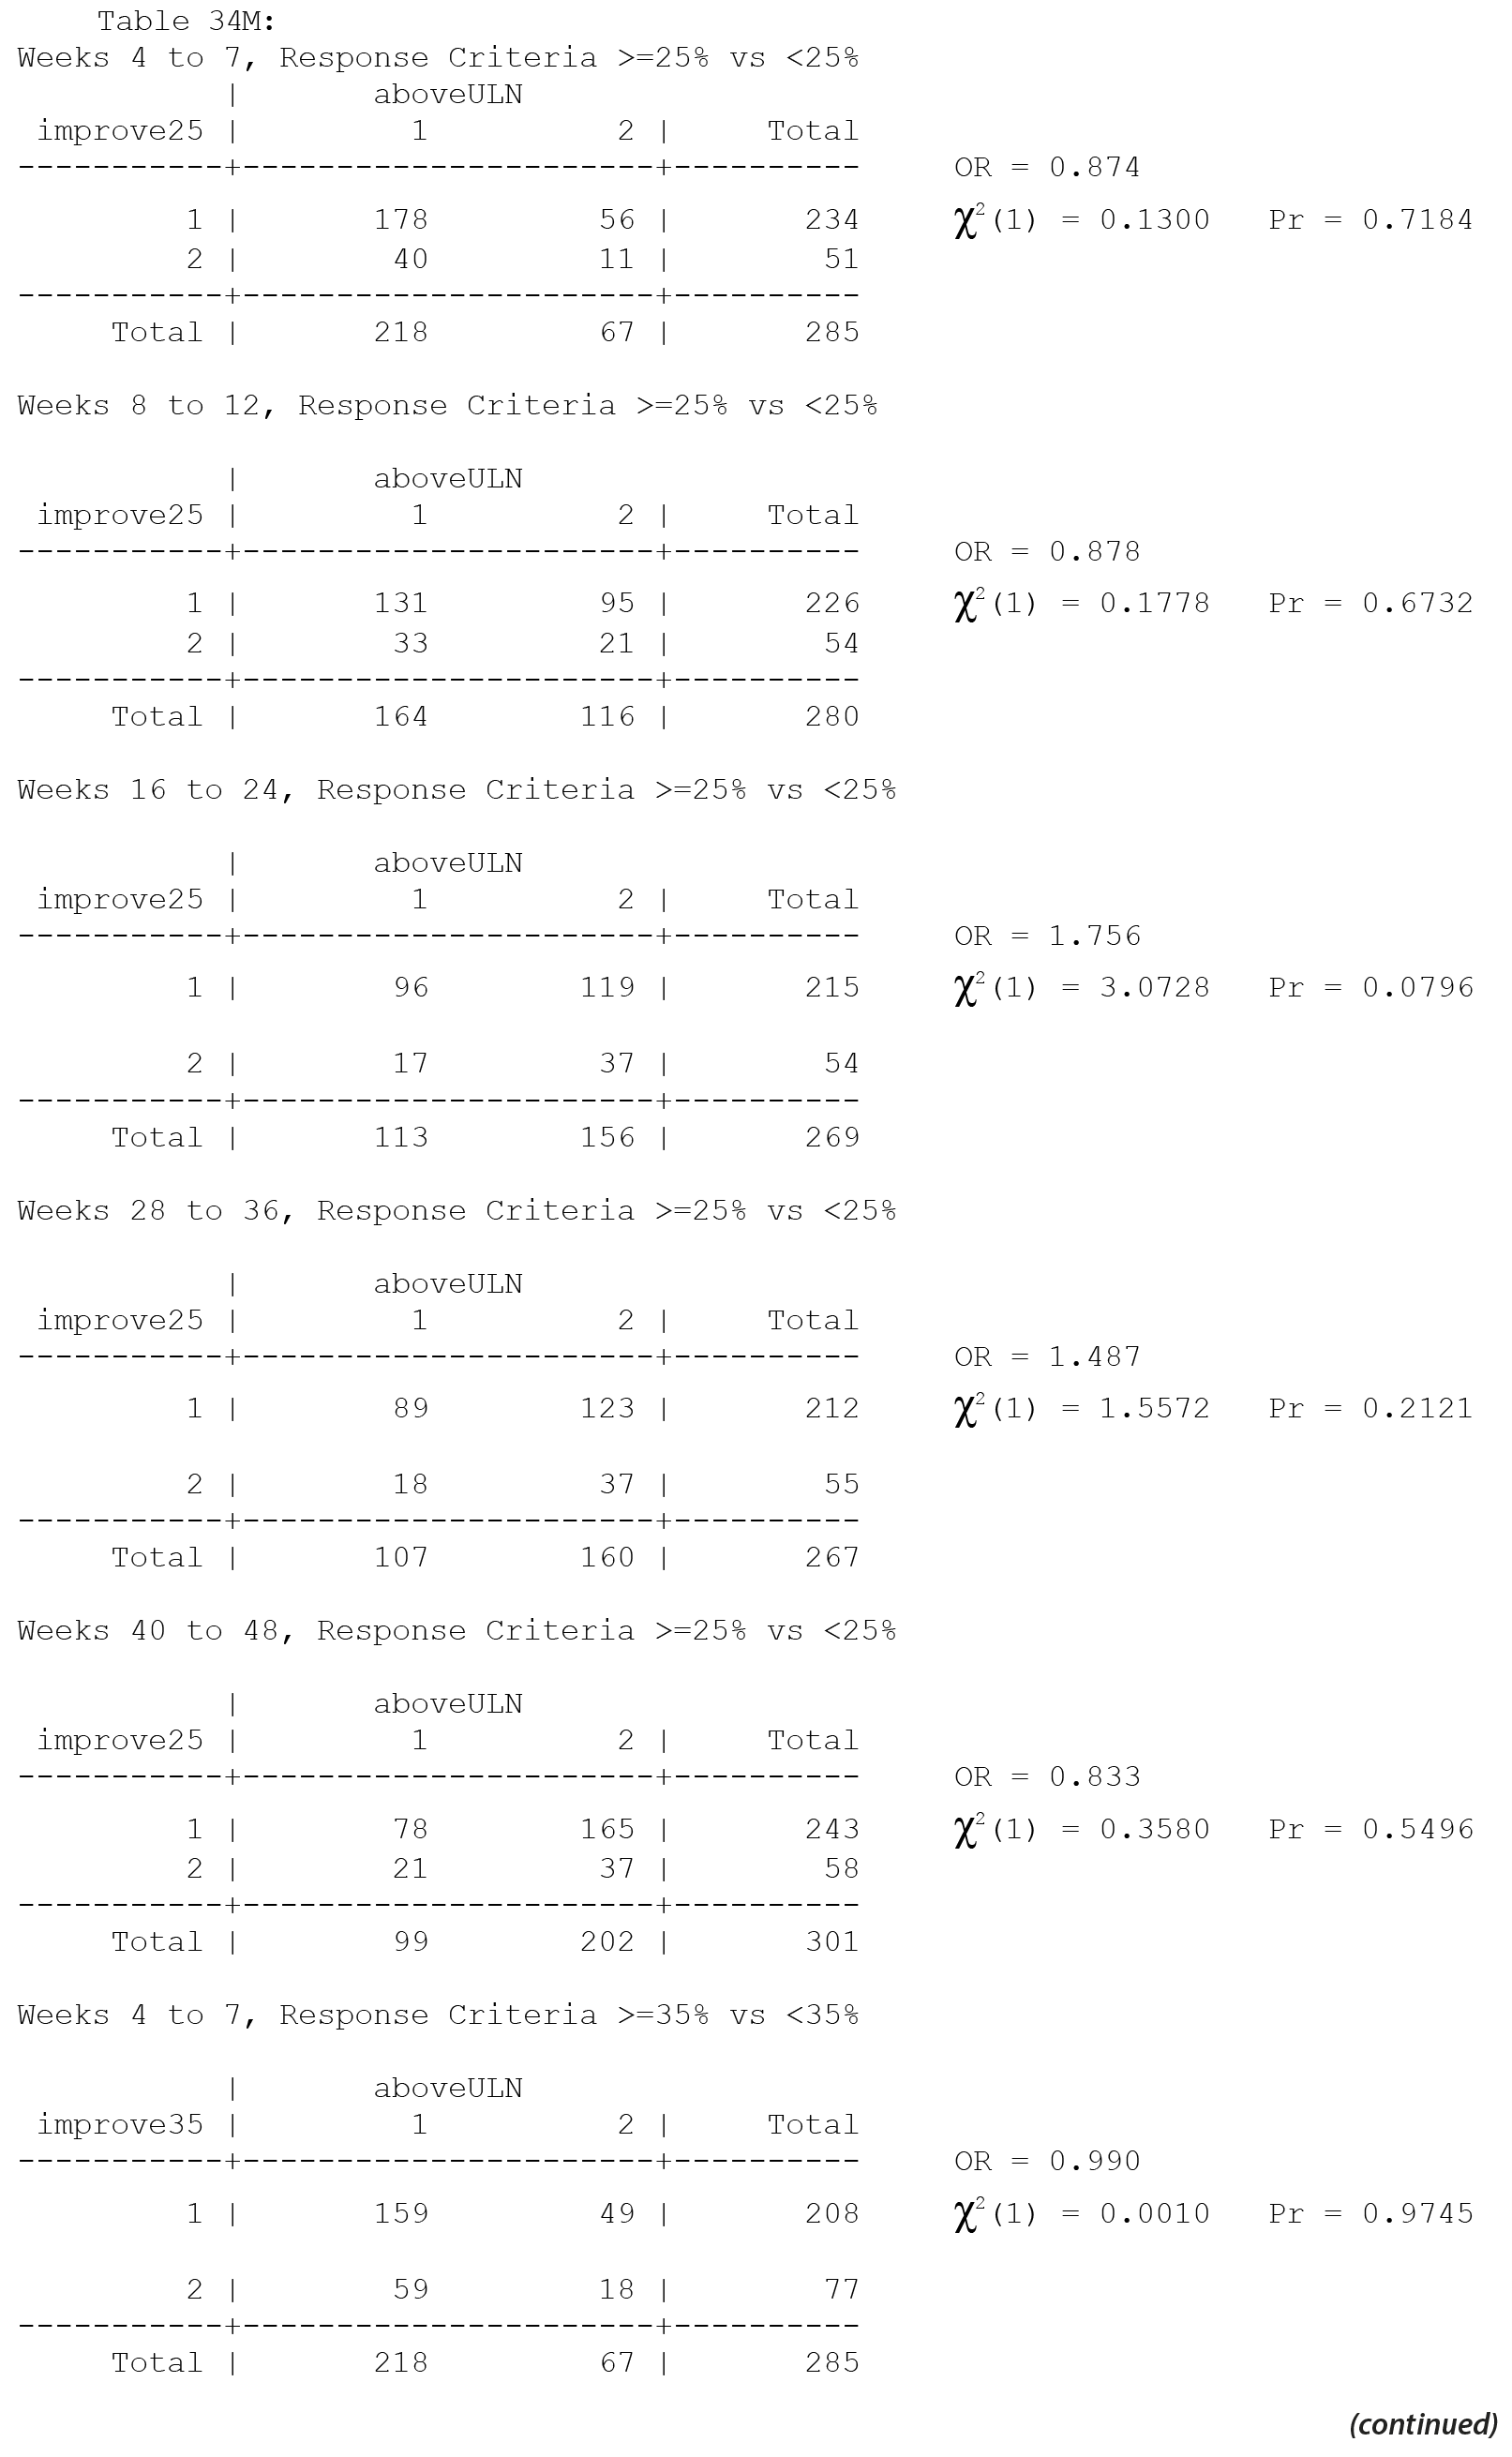
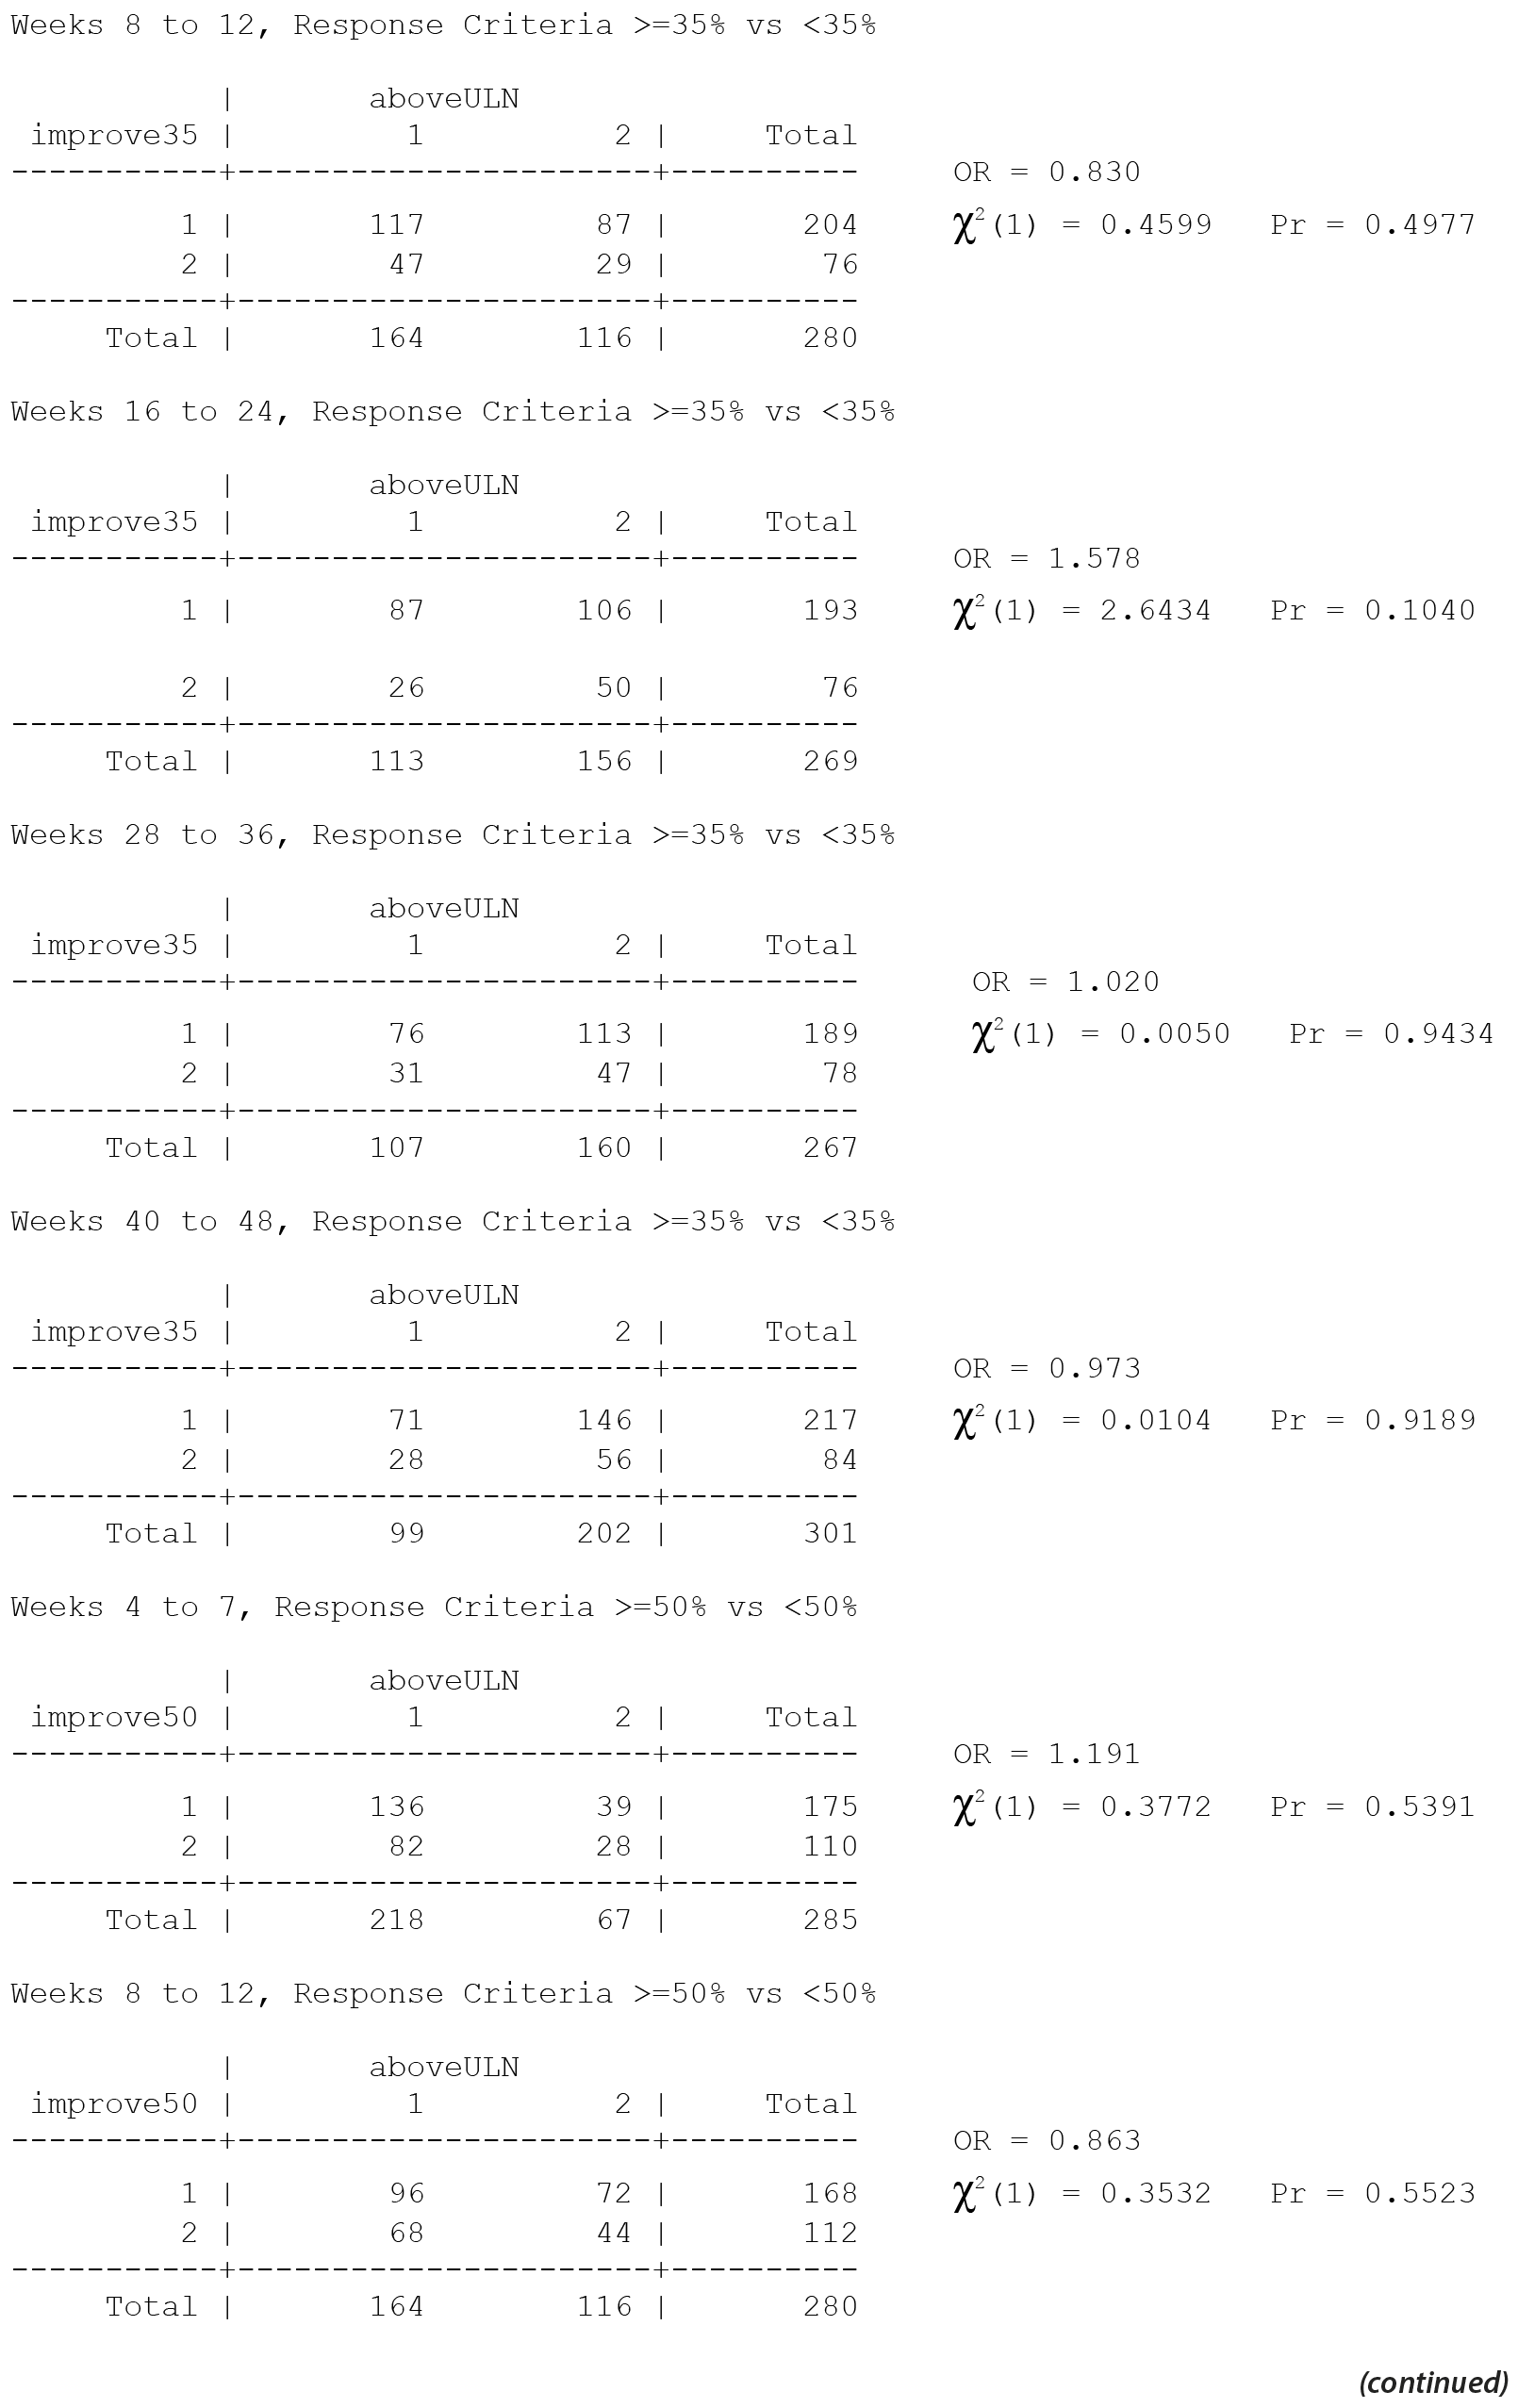
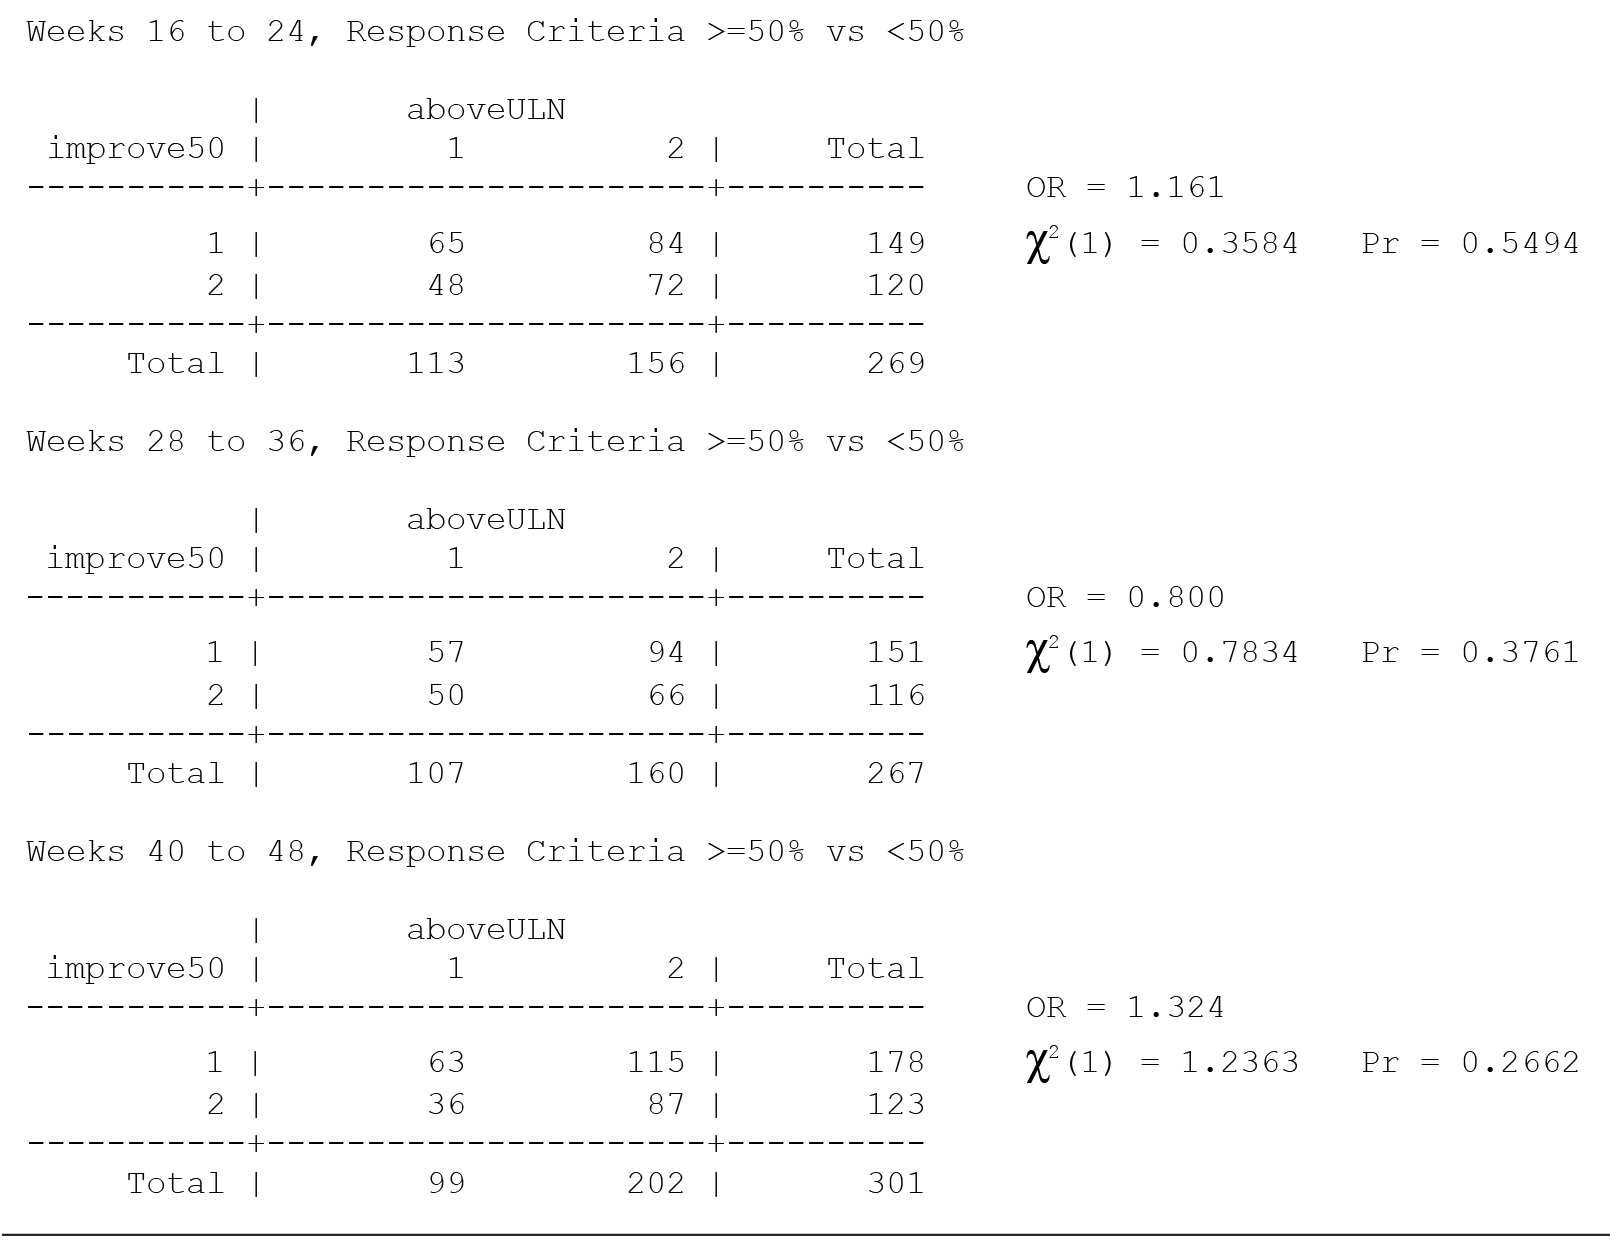
The primary efficacy measure for these clinical trials was the Nisonger Child Behavior Rating Form (N-CBRF). The analysis originally done for Table 34, "Responders on the Conduct Problem Subscale of the N-CBRF by Prolactin Levels (PAP – As Observed): Frequency Tables," used 5 separate 2 ×— 2 tables and provided a P value for each table using 3 different response criteria. Thus, a total of 15 analyses were completed (5 analyses for each response criterion). The association between percent decrease in the N-CBRF (indicative of reduced symptomatology) and an elevated prolactin level above the ULN at a specific time period was examined.
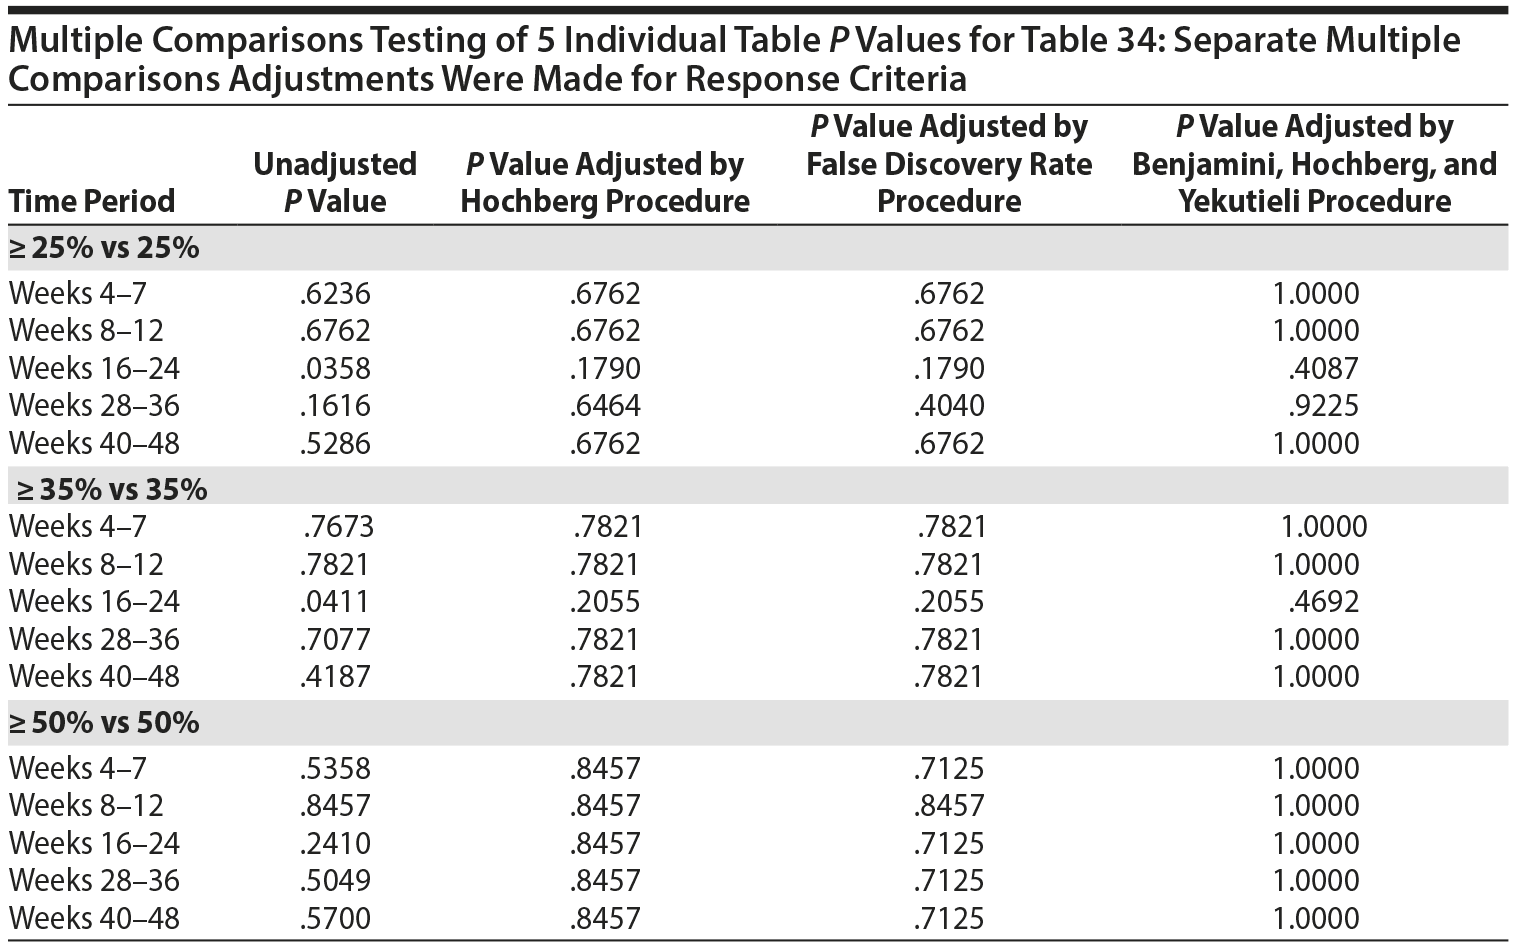
The original analyses suggested that either a ≥ 25% or a ≥ 35% decrement in the N-CBRF was associated with having a prolactin level above the ULN at weeks 16-24. Statistically, the same issues discussed for Table 21 apply to Table 34. The multiple comparisons corrected analyses for the original table are presented here, with separate multiple comparisons adjustments made for each response criteria.
Thus, considering the 5 individual tables separately for each of the 3 response criteria, after adjustment for multiple comparisons, there are no significant differences in the response rate, based on the change in N-CBRF, for those with a prolactin level above ULN versus those without a prolactin level above the ULN in any of the 5 time periods for any of the 3 response criteria.
All values in the original Table 34 were verified as correct. A version of Table 34 including males only, Table 34M, is included below.
There are no significant associations in Table 34 for males only without consideration of multiple comparisons and thus none with consideration of multiple comparisons.
6. AUTHORSHIP
Finally, concerns about authorship have been raised. To the best of our recollection, we met all 4 criteria for authorship according to International Committee of Medical Journal Editors guidelines. At the time of this paper’s publication, we believed that nonauthor contributors were appropriately acknowledged. However, during the course of legal proceedings and reports in the media, we have learned that there may have been nonauthor contributors to this paper who were unknown to us at the time of the paper’s publication. If there were nonauthor contributors, we do not know their identities or their specific contributions.
7. Summary
To summarize, the results of our reanalysis support our statements in the manuscript. Of particular note, our finding that there was no direct correlation between prolactin elevation and SHAP is supported by the data in the reanalysis. In addition, our Conclusion section remains accurate.
References
1. Findling RL, Kusumakar V, Daneman D, et al. Prolactin levels during long-term risperidone treatment in children and adolescents. J Clin Psychiatry. 2003;64(11):1362-1369. PubMed doi:10.4088/JCP.v64n1113
2. Begg MD. Analyzing k (2 x 2) tables under cluster sampling. Biometrics. 1999;55(1):302-307. PubMed doi:10.1111/j.0006-341X.1999.00302.x
3. Begg MD, Paykin AB. Performance of and software for a modified Mantel’ Haenszel statistic for correlated data. J Stat Comput Simul. 2001;70(2):175-195. doi:10.1080/00949650108812115
4. Crocker MK, Stern EA, Sedaka NM, et al. Sexual dimorphisms in the associations of BMI and body fat with indices of pubertal development in girls and boys. J Clin Endocrinol Metab. 2014;99(8):E1519-E1529. PubMed doi:10.1210/jc.2014-1384
5. Kley HK, Deselaers T, Peerenboom H, et al. Enhanced conversion of androstenedione to estrogens in obese males. J Clin Endocrinol Metab. 1980;51(5):1128-1132. PubMed doi:10.1210/jcem-51-5-1128
aDepartment of Psychiatry & Behavioral Sciences, Johns Hopkins University, Baltimore, Maryland
bDepartment of Pediatrics, University of Toronto and the Hospital for Sick Children, Toronto, Ontario, Canada
Potential conflicts of interest: Dr Findling receives or has received research support from, acted as a consultant for, and/or served on a speakers bureau for Alcobra, American Academy of Child & Adolescent Psychiatry, American Physician Institute, American Psychiatric Press, AstraZeneca, Bracket, Bristol-Myers Squibb, CogCubed, Cognition Group, Coronado Biosciences, Dana Foundation, Elsevier, Forest, GlaxoSmithKline, Guilford Press, Johns Hopkins University Press, Johnson & Johnson, Jubilant Clinsys, KemPharm, Lilly, Lundbeck, Merck, National Institutes of Health, Neurim, Novartis, Noven, Otsuka, Oxford University Press, Pfizer, Physicians Postgraduate Press, Purdue, Rhodes Pharmaceuticals, Roche, Sage, Shire, Sunovion, Supernus Pharmaceuticals, Transcept Pharmaceuticals, Validus, and WebMD. Dr Daneman has no potential conflicts of interest to disclose.
Funding/support: The original study was supported by Janssen-Ortho Inc. Janssen funded Dr Bilker’s work on the reanalyses for this letter to the editor.
J Clin Psychiatry 2016;77(2):e155-e170
dx.doi.org/10.4088/JCP.15l10500
© Copyright 2016 Physicians Postgraduate Press, Inc.
This PDF is free for all visitors!
