Some curious observations emerge from a scrutiny of clinical trial research in psychiatry. For example, small studies often yield statistically significant outcomes, whereas large studies often fail to separate experimental drug from placebo, there are plenty of failed trials even for drugs that are subsequently approved by regulatory authorities, and number needed to treat (NNT) values are often large, implying that medications play only a small role in eliciting clinical benefits. There are many good explanations for these 3 observations, and 1 involves the variability of the outcome measures in clinical trials. Such variability can be true or spurious. If the true value of the outcome measure is considered a signal, spurious variability in the signal is due to a phenomenon termed noise. There is little discussion on signal and noise in psychiatric literature. This article therefore discusses the signal-to-noise ratio, true and spurious variability, and their impact on clinical trial research as well as everyday clinical practice. When variability of the outcome measure is low, even small sample studies may yield statistically significant outcomes. When studies are conducted at many sites, variability due to noise increases, the value of the signal-to-noise ratio falls, and statistically significant outcomes may not be detected or, if they are detected, the NNT is inflated.

- Response to medication is an example of a “signal” that clinicians and researchers wish to detect and measure.
- Medication response varies across patients. Some of the variability is genuine and is due to reasons that are intrinsic to the patient. Some of the variability is spurious and is due to measurement error or “noise.”
- This article explains the concept of the signal-to-noise ratio as applied to clinical research and practice. Examples of sources of noise are provided. Suggestions are made for how to reduce noise in clinical assessments.
Clinical Questions
Clinicians are often puzzled by questions such as the following:
- Why do large, double-blind, randomized controlled trials (RCTs) so often fail to yield a statistically significant result favoring the trial medication? This question appears particularly applicable to antidepressant trials in both adult and pediatric populations, even with drugs that are later approved by regulatory authorities.1,2
- Why are there so many small RCTs with statistically significant results? One would expect that with smaller samples it would be more difficult, not easier, to achieve statistical significance.
- Why is the number needed to treat (NNT) figure so large in antidepressant and other RCTs3,4? Do medications really play such a small role in eliciting treatment response?
These questions have several answers. For example, RCTs often fail because clinical trials are designed and executed in a way that inevitably recruits a high placebo response.5 Because there is a limit to how much patients receiving an experimental drug can expect to improve, enhancement of response in the control group will shrink the difference in outcomes between drug and placebo, predisposing to statistically nonsignificant outcomes. Or, if the difference between groups is indeed statistically significant, the NNT is large because it took a really large sample in a multicenter study to show a small advantage for the experimental drug. Finally, small RCTs seemingly more often have significant outcomes because there may be an equal number of small RCTs with negative outcomes that have not been published, perhaps because authors or journal editors were insufficiently interested in the results. These and other explanations have been discussed elsewhere.6,7 A clear, practical discussion on the subject is also available on the Web.8
With regard to the clinical questions listed above, the present article will introduce a concept that has received little attention in psychiatric literature. This concept relates to noise in the measurement of outcome variables and the signal-to-noise ratio in research. This article will also discuss how variability in the signal affects RCT outcomes.
The Signal-to-Noise Ratio
The signal-to-noise ratio is an important concept in several different sciences, including medicine. The concept is quite simple. Imagine that you are at a party where many groups of people are talking and laughing over the sound of raucous rock music. If you speak to your friends in a normal conversational voice, whether or not you are heard well will depend on the signal-to-noise ratio, that is, how well your “signal” can be clearly discerned amid the general background “noise.”
Event-related potentials (ERPs) provide an excellent illustration of the signal-to-noise ratio in neuropsychiatry. In ERPs, an event such as a sensory stimulus triggers a small spike in the electroencephalogram (EEG) in a part of the brain. This spike cannot be easily identified because it is submerged in the background brain electrical activity. The spike is the signal, and the background EEG activity is the noise. Now, if the sensory stimulus is repeated hundreds of times and if the EEG activity is recorded and averaged, the signal becomes easier to identify because it is a consistent response, whereas the background EEG activity, being relatively and contextually random, tends to cancel out.9
The Signal-to-Noise Ratio in Clinical Research and Practice
In clinical trial research, the signal is anything that the investigator is trying to measure. Noise is anything that produces a smear in the value of the signal, making it hard to identify the true value of the signal. For example, in a clinical trial of a new antidepressant, severity of depression is a signal of interest. This signal needs to be accurately measured as distinct from the background noise. Examples of sources of background noise that could interfere with the accurate measurement of this signal are a quarrel that the patient had that affects his mood, the long journey to the hospital that increases his fatigue, the anticipated discomfort associated with blood sampling that bumps up his anxiety levels, the reassurance provided by the clinical team that makes him feel better, and the nonprescription medication he is taking that improves his sleep. Readers may note that noise of this nature may interfere with interpretations of clinical status in everyday clinical practice as well, much as it does in clinical trials.
The real signal, which explains how the antidepressant has affected his depression ratings, must be picked out from all the background factors that add noise to the signal. Thus, in clinical research as in ERP studies, the background noise merges with the signal and requires averaging across a large number of participants for the signal to be identified. The greater the noise, the smaller the signal-to-noise ratio and the larger the sample size necessary to identify the signal.
Noise, Variability, and Their Effects in RCTs
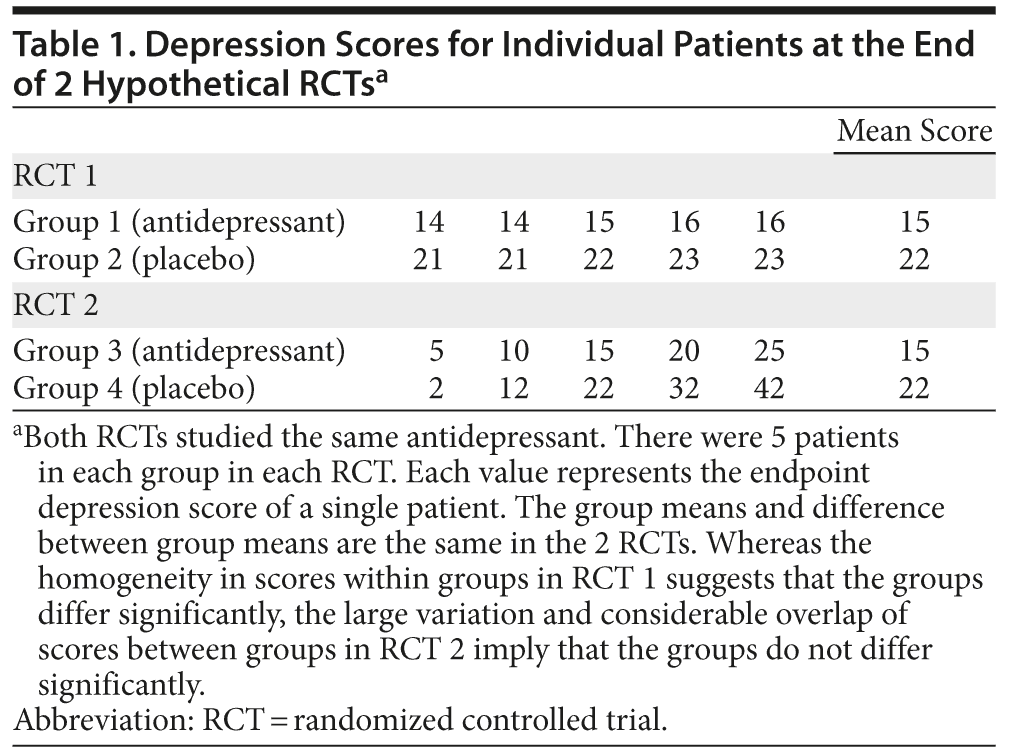
Noise in clinical trials increases the variability in the value of the signal. Different patients will experience different sources and intensities of noise; therefore, the magnitude and direction of the noise-induced variation will vary across patients, as should be obvious from the examples provided earlier. The greater the variation, the more difficult it becomes to identify a signal and hence the more difficult it is to demonstrate statistical significance. This phenomenon can be understood from the hypothetical and considerably exaggerated data presented in Table 1. The numbers in the table are the depression scores in different patients at the end of 2 RCTs that compared the same antidepressant drug with placebo. Patients in group 1 received drug, and those in group 2 received placebo. It is intuitively apparent that the patients in group 1 improved more than did those in group 2; that is, drug was superior to placebo.
Unfortunately, there was greater noise in the second RCT, and, although the mean values for and the difference between groups 3 (drug) and 4 (placebo) remain the same, the superiority of drug over placebo is no longer convincing, because there is greater variability within groups and hence substantial overlap of scores between groups.
From a statistical perspective, greater variability due to noise means that, for a given sample size, it becomes harder to detect the signal and hence a statistically significant outcome. In such situations, the sample size needs to be larger to detect the signal that the antidepressant drug results in lower depression ratings than placebo, if indeed this is the case.
True Variability and Noise
Noise is anything that introduces unreliability in the rating of a variable in a study. Noise increases the variability in the signal, but not all variability in the signal is due to noise. Expressed otherwise, variability can be true or spurious; the latter reflects an inaccurate estimation of the signal and is due to noise.
True variability arises from sources that are intrinsic to the patient, such as genetically driven or age-driven differences in antidepressant response, differences in the ways in which men and women experience depression, differences in the nature and degree of the stressors that maintain the depression, and so on. The signal is truly different across individuals. In a multicenter RCT, true variability can also arise from genuine population differences across sites.
Spurious variability arises from sources that are external to the patient, such as differences in the ways in which patients are recruited, managed, and rated. In single-site studies, the same investigators usually run the study from beginning to end, and the same standard operating procedures are applied in a similar fashion to all recruited patients. So, external biases (if any) in recruitment, management, and rating tend to move all ratings of the signal in the same way, and the variability may not be much increased. If variability is not amplified, smaller samples may suffice to identify statistically significant outcomes, if any.
In multicenter studies, despite attempts to standardize operating procedures across sites, there could be intersite differences in the thresholds for recruitment, differences in the thresholds for advising rescue medications, differences in nonspecific psychotherapeutic support, differences in the ways in which patients are rated, and even differences in decision-making related to removing patients from the study (resulting in differences in last-observation-carried-forward values). As a result, there is a potential for a considerable increase in the variability of the outcomes that are rated. For all these reasons, the signal is vulnerable to being smeared in multicenter RCTs. The resultant increase in variability and fall in the signal-to-noise ratio make it harder for the study to identify statistically significant outcomes. Thus, a large sample is necessary to pick out the signal from the noise, and the eventual NNTs are large.
Reducing Noise and Variability: Advantages and Disadvantages
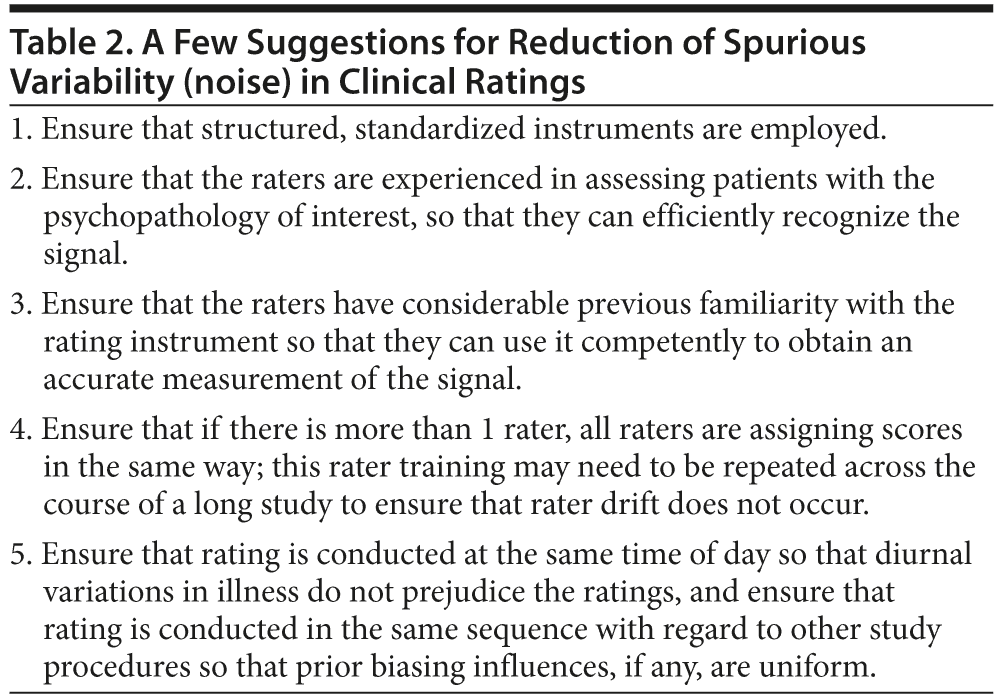
A great deal could be written on how to reduce variability that arises from noise, all of which has to do with uniform observance of standard operating procedures within and across recruitment sites, as well as the maintenance of high standards of rater reliability. A few examples of how to reduce spurious variability are listed in Table 2; for the rest, the reader is referred to standard texts on research methodology and on how to conduct clinical trials.
The suggestions listed in Table 2 all address the reliability of clinical ratings. Does reduction in noise through improvement in reliability really make a different to the conduct of clinical trials? Yes, indeed. For example, over a decade ago, Perkins et al10 showed that improvement in reliability could meaningfully reduce the sample size necessary for an adequately powered study.
There are also ways in which true variability can be reduced, and all involve recruiting as homogeneous a sample as possible, such as patients of a particular gender, in a particular age group, with a specific diagnosis and subdiagnosis, with a specified severity of illness, with similar history of previous medication exposure, and so on. Controlling environment (inpatient, as opposed to outpatient setting) could also help.
Reduction in noise is definitely desirable because it improves the internal validity of a study and its conclusions. Reduction in true variability, however, will improve the ability of the study to detect the signal but will compromise the external validity of the study because the results may not be easily generalizable to other populations. This is a well-known limitation of regulatory RCTs that exclude patients with personality disorders, substance abuse, comorbidities, and other descriptors that commonly characterize patients seen in everyday clinical practice. Researchers must therefore decide what they want from the study: to detect the signal or to generalize the results of the study.
Animal studies are a particular example of how reduction in variability can be advantageous as well as disadvantageous. Such studies commonly employ (for example) rats that are of the same age, body weight, gender, and inbred strain. The animals are housed and studied in a carefully controlled environment that is free from environmental disturbances. The animals are handled in the same way and are studied at the same time of day. True variability and variability due to noise are simultaneously reduced to a minimum. As a result, it is very easy to pick up even a small signal. However, this same signal could be completely drowned out in clinical trials because of the complex genetic and environmental variability that characterizes patients and because of the noise that is inevitable in clinical trial research. This is one of the many reasons why a finding that is statistically significant in the laboratory may not be statistically significant in clinical contexts.11
Parting Note
In the RCT situations discussed, the signal-to-noise ratio was explained in the context of dependent variables, such as the severity of depression in an antidepressant trial. However, the concept applies to the measurement of any variable, whether dependent or independent. For example, noise can contaminate the measurement of blood pressure in a study of how hypertension impacts the risk of Alzheimer’s disease in later life. In this example, blood pressure is an independent variable.
J Clin Psychiatry 2013;74(5):479-481 (doi:10.4088/JCP.13f08475)
© Copyright 2013 Physicians Postgraduate Press, Inc.
 Each month in his online column, Dr Andrade considers theoretical and practical ideas in clinical psychopharmacology with a view to update the knowledge and skills of medical practitioners who treat patients with psychiatric conditions.
Department of Clinical Psychopharmacology and Neurotoxicology, National Institute of Mental Health and Neurosciences, Bangalore, India ([email protected]).
Financial disclosure and more about Dr Andrade.
References
1. Kirsch I, Deacon BJ, Huedo-Medina TB, et al. Initial severity and antidepressant benefits: a meta-analysis of data submitted to the Food and Drug Administration. PLoS Med. 2008;5(2):e45. PubMed doi:10.1371/journal.pmed.0050045
2. Andrade C, Bhakta SG, Singh NM. Controversy revisited: selective serotonin reuptake inhibitors in paediatric depression. World J Biol Psychiatry. 2006;7(4):251-260. PubMed doi:10.1080/15622970600702690
3. Arroll B, Elley CR, Fishman T, et al. Antidepressants versus placebo for depression in primary care. Cochrane Database Syst Rev. 2009;(3):CD007954. PubMed
4. Tsapakis EM, Soldani F, Tondo L, et al. Efficacy of antidepressants in juvenile depression: meta-analysis. Br J Psychiatry. 2008;193(1):10-17. PubMed doi:10.1192/bjp.bp.106.031088
5. Andrade C. There’s more to placebo-related improvement than the placebo effect alone. J Clin Psychiatry. 2012;73(10):1322-1325. PubMed doi:10.4088/JCP.12f08124
6. Kobak KA, Kane JM, Thase ME, et al. Why do clinical trials fail? the problem of measurement error in clinical trials: time to test new paradigms? J Clin Psychopharmacol. 2007;27(1):1-5. PubMed doi:10.1097/JCP.0b013e31802eb4b7
7. Greist J, Mundt J, Jefferson J, et al. Comments on “Why do clinical trials fail? the problem of measurement error in clinical trials: time to test new paradigms?” J Clin Psychopharmacol. 2007;27(5):535-537. PubMed doi:10.1097/JCP.0b013e31814f2c14
8. Chin R. Why clinical trials fail. Clinicaltrialist Web site. http://clinicaltrialist.wordpress.com/clinical/why-clinical-trials-fail/. Accessed March 18, 2013.
9. Woodman GF. A brief introduction to the use of event-related potentials in studies of perception and attention. Atten Percept Psychophys. 2010;72(8):2031-2046. PubMed
10. Perkins DO, Wyatt RJ, Bartko JJ. Penny-wise and pound-foolish: the impact of measurement error on sample size requirements in clinical trials. Biol Psychiatry. 2000;47(8):762-766. PubMed doi:10.1016/S0006-3223(00)00837-4
11. Andrade C, Sudha S, Venkataraman BV. Herbal treatments for ECS-induced memory deficits: a review of research and a discussion on animal models. J ECT. 2000;16(2):144-156. PubMed doi:10.1097/00124509-200006000-00006
This PDF is free for all visitors!


