- A 95% confidence interval (CI) for a statistical value (eg, sample mean) is a range that is 95% likely to contain the true population value.
- A 95% CI provides an understanding of the precision with which the parameter has been estimated; narrow CIs indicate greater precision.
- In clinical trials, 95% CIs can provide an understanding of the possible magnitude of an effect, its statistical significance, and even its clinical significance.

ABSTRACT
Research papers and research summaries frequently present results in the form of data accompanied by 95% confidence intervals (CIs). Not all students and clinicians know how to interpret CIs. This article provides a nontechnical, nonmathematical discussion on how to understand and glean information from CIs; all explanations are accompanied by simple examples. A statistically accurate explanation about CIs is also provided. CIs are differentiated from standard deviations, standard errors, and confidence levels. The interpretation of narrow and wide CIs is discussed. Factors that influence the width of a CI are listed. Explanations are provided for how CIs can be used to assess statistical significance. The significance of overlapping and nonoverlapping CIs is considered. It is concluded that CIs are far more informative than, say, mere P values when drawing conclusions about a result.
J Clin Psychiatry 2015;76(2):e228-e231 (doi:10.4088/JCP.14f09751).
© Copyright 2015 Physicians Postgraduate Press, Inc.
Clinical Question
You are reading a meta-analysis on antipsychotic augmentation with modafinil or armodafinil for the treatment of negative symptoms of schizophrenia.1 You observe that, on the Positive and Negative Syndrome Scale, negative subscale (PANSS-N), augmentation with either of these drugs was superior to augmentation with placebo by a mean of 0.27 points. Which of the following statements is more informative?
1. Armodafinil was superior to placebo on the PANSS-N; the mean difference was 0.27 points (P = .02).
2. Armodafinil was superior to placebo on the PANSS-N; the mean difference was 0.27 (95% confidence interval [CI], 0.04-0.50) points.
Introduction
Consider a randomized controlled trial (RCT) in which an antidepressant drug elicits a 63% response rate in patients with major depressive disorder. There is no assurance that this drug will elicit a 63% response rate in future clinical trials, or in real-world practice. In other words, the 63% response rate that was obtained from the sample in the RCT is merely an approximation of the true response rate in the population of patients with major depressive illness.
All descriptive statistics in a clinical study are approximations for the population from which the sample was drawn. Thus, descriptive statistics such as mean improvement in illness severity, mean difference in outcome ratings between active drug and placebo, response rate to a particular drug, numbers needed to treat, and other statistics are all approximations. In this context, for any given statistic the 95% CI provides us with an estimate of where the population value lies. The rest of this article will provide a nontechnical, nonmathematical explanation about 95% CIs and how they are interpreted.
Interpreting 95% Confidence Intervals
Let us first look at an easy-to-understand, though slightly inaccurate, explanation. The 95% CIs for a particular statistical parameter are the values between which we are 95% certain that the population value lies. With reference to the example provided in the Clinical Question at the start of this article, we can be 95% certain that the true value for the advantage for armodafinil over placebo is somewhere between 0.04 and 0.50 PANSS-N points.
Taking the interpretation one step further, there is a 2.5% chance that the population value will lie below 0.04 and a 2.5% chance that the population value will lie above 0.50. In other words, we can be 97.5% certain that armodafinil will outperform placebo by at least 0.04 PANSS-N points, and, by the same token, we can be 97.5% certain that the advantage for armodafinil over placebo will not exceed 0.50 PANSS-N points.
Here is another example. A register-based study2 found that the overall risk of major congenital anomalies was 1.08 (95% CI, 0.96-1.22) after exposure to selective serotonin reuptake inhibitors (SSRIs) during the first trimester of pregnancy. We can interpret this as follows. In this study, SSRI exposure was associated with an 8% increase in the risk of major congenital anomalies. The real effect of SSRI exposure, however, can be as high as a 22% increase in risk, or as low as a 4% decrease in risk.
Taking the interpretation 1 step further, if the risk of major congenital anomalies in the unexposed population is 2% (which is a reasonable estimate), then SSRI exposure will increase this value by up to 22%; that is, up to 2.44%. Thus, we can be 97.5% certain that SSRI exposure during the first trimester of pregnancy will not increase the absolute risk of major congenital anomalies beyond 2.44%.
A Statistically More Accurate Interpretation
The explanation provided in the previous section is actually a simplification. This section provides a more precise explanation. Imagine that you conduct a study, obtain a mean, and calculate the 95% CI for the mean. Now, imagine that you repeat the study. You will almost certainly get a different value for the mean and the 95% CI. In other words, in 2 different studies you obtain 2 different ranges in which you believe the population mean is 95% certain to lie. However, the population mean is a fixed value and will not change no matter how many times you repeat the study and re-estimate the 95% CI.
So, a more correct interpretation is as follows: If we repeat the study 100 times, then 95 of the estimated 95% CIs would contain the population mean. In other words, if we examine the 95% CI that we have estimated from a single study, the probability that this particular CI contains the population mean is 95%. This is not the same as saying that we are 95% certain that the population mean lies in the range that we have estimated from a single study.
Standard Deviation, Standard Error, and the 95% Confidence Interval
The range defined by the mean ± 2 standard deviations (SDs) includes 95.5% of the population; this is a well-known property of the normal distribution. Perhaps this is why some persons wrongly believe that the 95% CIs contain 95% of the values in a study. There is, however, a relationship between the SD and the 95% CI or, to be more accurate, between the standard error (SE) and the 95% CI. Simply stated, the SE is an input in the calculation of the 95% CI. If the SE is wide, the CI will be wide. If the SE is narrow, the CI will be narrow.
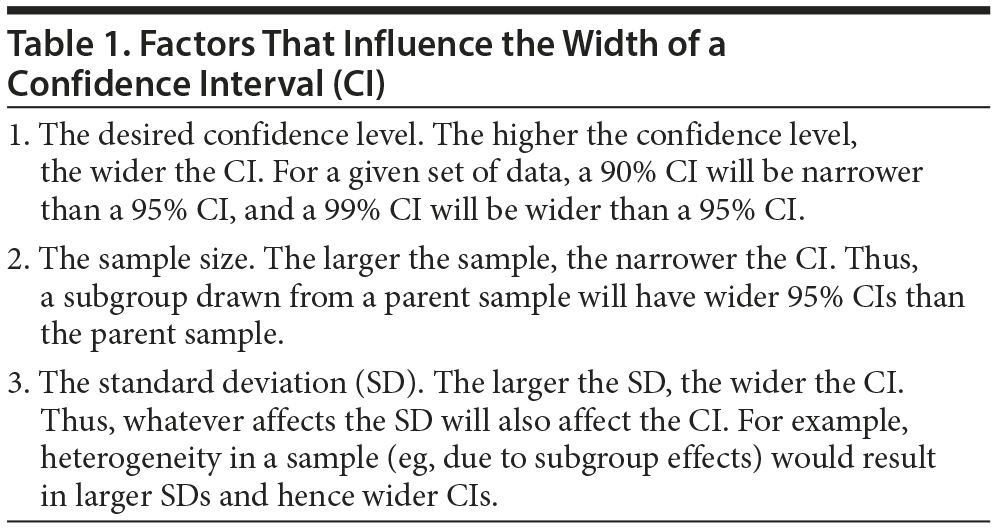
For continuous data, which are summarized using statistics such as the mean or the difference between means, if the SD is wide, the SE of the mean will be wide, and the 95% CI will be wide. If the SD is narrow, the SE of the mean will be narrow, and the 95% CI will be narrow (Table 1).
Narrow and Wide Confidence Intervals
Wide CIs indicate uncertainty; narrow CIs indicate precision. If a drug is associated with a 63% response rate and the 95% CIs are, say, 40%-86%, it means that we don’ t really know how good or bad that drug is; the range is too wide. However, if the 95% CI is 60%-65%, it means that we are pretty certain about how effective the drug is; in fact, we are 95% certain that the response rate to the drug is in the region of 60%-65%. This distinction between narrow and wide CIs applies to all CIs, regardless of what they describe—means, differences between means, response rates, remission rates, standardized mean differences, relative risks, odds ratios, numbers needed to treat or harm, etc.
How can a researcher improve the precision of the study, that is, increase the chances of obtaining narrow CIs? Larger samples are associated with narrower CIs (Table 1). In fact, quadrupling the sample size would halve the CI.3 Readers may note here that larger sample size will not change the SD unless there was a grievous sampling error in the smaller sample.4
As already stated, wide CIs may indicate small sample size and hence an inability to be accurate in the estimate of where the population value lies. Sometimes, wide CIs may also indicate a subgroup effect (Table 1). For example, if age at onset of schizophrenia is significantly lower in men than in women,5 then mixing men and women in a single sample is likely to yield a more dispersed set of values; the SD would be wider, and hence the 95% CI would also be wider. So, wide 95% CIs in a study of age at onset of schizophrenia could indicate a subgroup effect for men and women.
Confidence Intervals and Statistical Significance
A P value of .05 is generally considered to indicate a statistically significant finding, and 95% CIs can provide an indication of statistical significance at the .05 level, as the following examples show:
1. Difference between means. Consider a hypothetical RCT in which an antidepressant drug reduces the depression ratings by a mean of 12 points, and placebo reduces the ratings by a mean of 9 points. The mean difference between the 2 treatments is 3 points. Assume that the 95% CI for this difference between means is 1.5- 4.5 points. Now, we know that if drug is no better than placebo, the difference between drug and placebo will be 0, or even negative; in the latter case, patients improve less with drug than with placebo. So, if the 95% CI lies entirely above 0, the drug should be superior to placebo at the 5% (P < .05) level. In the example here, the 95% CI is 1.5-4.5, and this is entirely above 0. We can therefore be 95% certain that this interval contains the population mean and hence that the antidepressant is statistically significantly superior to placebo (P < .05).
What if the 95% CI had, instead, been −1.5 to 7.5? Then, we would have noted that even though the antidepressant was superior to placebo by 3 points, the 95% CIs indicate the possibility that it can be no different from placebo (difference = 0) or even worse than placebo (difference in the negative zone). We would then conclude that the antidepressant is not superior to placebo to a statistically significant extent (P > .05).
Summing up, if the 95% CI for the difference between means (of 2 groups) includes 0, the difference between the groups is not statistically significant at the 5% level.
2. Difference between proportions. Consider another hypothetical situation. In an RCT, antidepressant treatment is associated with a 55% response rate, and placebo, with a 45% response rate; the difference between these 2 proportions is 10%, and the 95% CI for the difference between these 2 proportions is 4%-16%. If there is no difference in efficacy between antidepressant and placebo, the difference in response rates should be 0%. However, the entire 95% CI that we have obtained is observed to lie above 0%. So, we are 95% confident that this CI truly contains the population value for the difference in response rates between drug and placebo and that the drug is superior to placebo to a statistically significant extent (P < .05). If the 95% CI had included 0 and some negative values (eg, −2% to 22%), then we would have concluded that the 10% advantage for drug over placebo does not reach statistical significance.
3. Other statistical parameters. Exactly the same principle applies to other statistical parameters, as well. Consider relative risks (RRs) and odds ratios (ORs). If there is no difference between groups, the RR or the OR will be 1.00. Suppose that medication use in pregnancy is associated with an increased odds of major malformations in the offspring; the OR is 1.67, and the 95% CI is 1.50-1.84. The entire CI lies above 1.00, and so we conclude that the increase in malformation risk is statistically significant at the 5% level.
Suppose that regular physical exercise is associated with lower odds of dementia after age 65 years (OR = 0.88; 95% CI, 0.82-0.94). The entire CI lies below 1.00, and so we conclude that regular physical exercise is associated with a reduced risk of dementia to a statistically significant extent.
Here are 2 examples in which the 95% CIs indicate absence of statistical significance:
a. RR = 0.7; 95% CI, 0.3-1.1
b. OR = 1.6; 95% CI, 0.9-2.3
In both examples, the 95% CIs include 1.00, the value that indicates “no difference” between groups.
4. Looking at where the bulk of the CI lies. A grade sheet which records that a student has passed (or failed) in an examination does not tell us whether the student passed (or failed) by a narrow or wide margin. Likewise, declaring that a result is statistically significant or nonsignificant provides the reader with no information about what the realities were.
Thus, it would be a mistake to look at the 95% CI and merely conclude that the difference between means or proportions is statistically significant (or not). It is far better to interpret the results of the study in the context of the range of values that might contain the population mean. In the example RR = 0.7; 95% CI, 0.3-1.1, it is clear that the lowering of risk is not statistically significant (the 95% CI includes 1.0). However, it is also apparent that most of the values in the CI lie below 1.0, implying that there is a good chance that the risk is truly lowered, except that it does not reach statistical significance in conventional terms.
Similarly, with the example OR = 1.6; 95% CI, 0.9-2.3, the odds are not significantly raised by conventional reckoning, but, because most of the CI lies above 1.0, there is a reasonably good chance that the odds are truly higher. The message here is that we should derive meaning from the interval as a whole, not merely from whether or not it indicates statistical significance. Probability lies along a continuum and is not a dichotomous construct.6
Confidence Intervals, Overlap, and Statistical Significance
In a hypothetical placebo-controlled RCT, the experimental drug reduces depression scores by 14.0 points (95% CI, 12.0-16.0), and placebo reduces the scores by 9.5 points (95% CI, 8.0-11.0). Is the drug superior to placebo in efficacy?
From the CIs that are presented, we conclude that there is a 97.5% chance that improvement with placebo is 11 points or less and that improvement with drug is 12 points or more. We can therefore safely conclude that if the 95% CIs do not overlap, the difference between groups is statistically significant at the 5% level, at least. This conclusion applies to any difference between groups, whether estimated as difference in mean scores, difference in response rates, difference in the frequency of adverse events, or other parameters.
What if there was indeed an overlap in the 95% CI? Consider a case in which improvement with drug is 14 (95% CI, 11-17) points and improvement with placebo is 9 (95% CI, 6-12) points. Although the 95% CIs do overlap, we cannot conclude that the groups do not differ significantly at the 5% level. A conventional inferential statistical test will need to be applied here.7 However, if overlap in CI is considerable, such as more than 50%, the difference is very unlikely to be statistically significant.
This eyeball test to determine statistical significance based on overlap should not be used for paired data, such as in pre-post situations in which the paired t test is applied.
Miscellaneous Notes About Confidence Intervals
CI values are usually reported to the second decimal place; however, it is not unusual for reporting to be to the first decimal place. Sometimes, such as when CIs are reported for data such as numbers needed to treat or harm, CIs are reported to the nearest integer. CIs are not reported to 3 decimal places.
Consider a 95% CI that is expressed as 5.15-12.40. The lower limit, or lower bound, of this CI is 5.15. The upper limit, or upper bound, is 12.40. The range is the difference between the upper and lower limits; that is, 7.25. The confidence limits are not necessarily symmetrically distributed around the estimate, especially when the estimate is, for example, a proportion.
Confidence interval should not be confused with confidence level, which is 1 – α, that is, 1.00 – 0.05, or 0.95, or 95%. Confidence level refers to the percentage of all possible samples that can be expected to include the true population value.
CIs are usually calculated as 95% CIs. However, sometimes 90% or 99% or even other CIs are presented, depending on the need of the situation. A 90% CI will be narrower and a 99% CI will be wider than a 95% CI (Table 1).
A Final Note
Having reached the end of this article, it is my hope that the reader will understand why 95% CIs are far more informative than P values. It is a matter of regret that many authors continue to publish papers that revolve around P values and in which CIs find little place. Readers who wish to read further on P values versus CIs are referred to Norman and Streiner.6
Acknowledgment: Dr Andrade acknowledges with thanks the assistance of David Streiner, PhD, CPsych, Professor, Department of Psychiatry & Behavioral Neurosciences, McMaster University, and Professor, Department of Psychiatry, University of Toronto, for his careful reading of a previous version of this manuscript and his suggestions for its improvement.
 Each month in his online column, Dr Andrade considers theoretical and practical ideas in clinical psychopharmacology with a view to update the knowledge and skills of medical practitioners who treat patients with psychiatric conditions.
Department of Clinical Psychopharmacology and Neurotoxicology, National Institute of Mental Health and Neurosciences, Bangalore, India ([email protected]).
Financial disclosure and more about Dr Andrade.
REFERENCES
1. Andrade C, Kisely S, Monteiro I, et al. Antipsychotic augmentation with modafinil or armodafinil for negative symptoms of schizophrenia: systematic review and meta-analysis of randomized controlled trials. J Psychiatr Res. 2015;60(1):14-21. PubMed doi:10.1016/j.jpsychires.2014.09.013
2. Malm H, Artama M, Gissler M, et al. Selective serotonin reuptake inhibitors and risk for major congenital anomalies. Obstet Gynecol. 2011;118(1):111-120. PubMed doi:10.1097/AOG.0b013e318220edcc
3. Altman DG, Bland JM. Uncertainty and sampling error. BMJ. 2014;349:g7064. PubMed doi:10.1136/bmj.g7064
4. Altman DG, Bland JM. Standard deviations and standard errors. BMJ. 2005;331(7521):903. PubMed doi:10.1136/bmj.331.7521.903
5. Eranti SV, MacCabe JH, Bundy H, et al. Gender difference in age at onset of schizophrenia: a meta-analysis. Psychol Med. 2013;43(1):155-167. PubMed doi:10.1017/S003329171200089X
6. Norman GR, Streiner DL. Do CIs give you confidence? Chest. 2012;141(1):17-19. PubMed doi:10.1378/chest.11-2193
7. Schenker N, Gentleman JF. On judging the significance of differences by examining the overlap between confidence intervals. Am Stat. 2012;55(3):182-186. doi:10.1198/000313001317097960