See Commentaries by Rothschild (see rejoinder by Papakostas) and Rush.
Article Abstract
Background: Previously, a biomarker panel was developed for use as an aid to major depressive disorder (MDD) diagnosis; it consisted of 9 biomarkers associated with the neurotrophic, metabolic, inflammatory, and hypothalamic-pituitary-adrenal axis pathways. This panel and associated algorithm produced good clinical sensitivity and specificity (92% and 81%, respectively) in differentiating MDD patients from individuals without MDD. To further validate the panel, we performed a prospective study using a larger set of new prospectively acquired MDD patients and a similarly collected population of nondepressed subjects. The addition of gender and body mass index (BMI) effects to the algorithm was also evaluated.
Method: Blood samples were obtained from MDD patients (n = 68) clinically evaluated at multiple sites in 2011 and 2012 using standard psychiatric assessment tools and structured clinical interviews according to DSM-IV criteria. Blood samples (n = 86) from nondepressed subjects were obtained as controls. MDD and nondepressed samples were randomized into independent training (n = 102) and validation sets (n = 52). Analytes in sera were quantified by immunoassay.
Results: Training set biomarker data were used to develop a logistic regression model that included gender and BMI in a manner that allowed for their interaction with the biochemical analytes. For the training set, the sensitivity and specificity of the test (with 95% CI) were 93% (0.80-0.98) and 95% (0.85-0.99), respectively. This method (designated the MDDScore) was then applied to the independent validation set and had a sensitivity and specificity of 96% (0.77-0.98) and 86% (0.66-0.95), respectively. The overall accuracy for the training set was 94%; the validation set accuracy was 91%.
Conclusion: Examination of a randomized independent set of samples confirms the ability of the previously established biomarker panel to identify persons with MDD; the accuracy was over 90%. The improved model that adds gender and BMI to the previously established panel of 9 biomarkers is robust and simple; it provides the most rigorously tested, objective diagnostic test for MDD to date.
From the Editors
Are you a healthcare provider?
Add your NPI to personalize your JCP experience.
This work may not be copied, distributed, displayed, published, reproduced, transmitted, modified, posted, sold, licensed, or used for commercial purposes. By downloading this file, you are agreeing to the publisher’s Terms & Conditions.
MDDScore: Confirmation of a Blood Test to Aid in the Diagnosis of Major Depressive Disorder

ABSTRACT
Background: Previously, a biomarker panel was developed for use as an aid to major depressive disorder (MDD) diagnosis; it consisted of 9 biomarkers associated with the neurotrophic, metabolic, inflammatory, and hypothalamic-pituitary-adrenal axis pathways. This panel and associated algorithm produced good clinical sensitivity and specificity (92% and 81%, respectively) in differentiating MDD patients from individuals without MDD. To further validate the panel, we performed a prospective study using a larger set of new prospectively acquired MDD patients and a similarly collected population of nondepressed subjects. The addition of gender and body mass index (BMI) effects to the algorithm was also evaluated.
Method: Blood samples were obtained from MDD patients (n = 68) clinically evaluated at multiple sites in 2011 and 2012 using standard psychiatric assessment tools and structured clinical interviews according to DSM-IV criteria. Blood samples (n = 86) from nondepressed subjects were obtained as controls. MDD and nondepressed samples were randomized into independent training (n = 102) and validation sets (n = 52). Analytes in sera were quantified by immunoassay.
Results: Training set biomarker data were used to develop a logistic regression model that included gender and BMI in a manner that allowed for their interaction with the biochemical analytes. For the training set, the sensitivity and specificity of the test (with 95% CI) were 93% (0.80-0.98) and 95% (0.85-0.99), respectively. This method (designated the MDDScore) was then applied to the independent validation set and had a sensitivity and specificity of 96% (0.77-0.98) and 86% (0.66-0.95), respectively. The overall accuracy for the training set was 94%; the validation set accuracy was 91%.
Conclusion: Examination of a randomized independent set of samples confirms the ability of the previously established biomarker panel to identify persons with MDD; the accuracy was over 90%. The improved model that adds gender and BMI to the previously established panel of 9 biomarkers is robust and simple; it provides the most rigorously tested, objective diagnostic test for MDD to date.
J Clin Psychiatry 2015;76(2):e199-e206
© Copyright 2015 Physicians Postgraduate Press, Inc.
Submitted: January 31, 2014; accepted July 14, 2014 (doi:10.4088/JCP.14m09029).
Corresponding author: John A. Bilello, PhD, Ridge Diagnostics Inc, 2 Davis Dr, Research Triangle Park, NC 27709 ([email protected]).
The most common approach to depression diagnosis in clinical settings is first to identify any physical causality and second, if a medical cause for the depression is ruled out, to conduct a psychological evaluation that usually consists of questions related to mood. Interpretation is often difficult because clinical depression can manifest differently between individuals. This long-standing approach to the clinical diagnosis of depression is often subject to great variation, and there is considerable imprecision relative to standardized assessments.1-5 Indeed, a recent meta-analysis of 38 studies published from 1995 to 2006 (N = 15,967 participants) showed that diagnoses generated from clinical evaluations often do not agree with the results of structured and semistructured interviews used in clinical research. For major depression, the most studied diagnosis, the prevalence was found to be 26% from standardized diagnostic interviews and 17% from clinical evaluations, a 1.5-fold difference.6 This clearly leaves considerable room for improvement.
Clinical assessments of MDD can be assisted by use of symptom scales such as the Beck Depression Inventory7 or the Hamilton Depression Rating Scale (HDRS).8 However, these approaches are not commonly used in clinical practice. Further, they do not include information derived from biological or pathophysiologic mechanisms. Accordingly, recognition and treatment of depression are often delayed and sometimes missed altogether, resulting in prolonged suffering and loss of social supports. Deleterious long-term effects of untreated MDD include increased length of episodes and recurrence,9 disability, loss of hippocampal volume,10 and possible cognitive impairment11 and suicide. In addition to being a chronic disease in its own right, the burden of depression is further increased because it is associated with poor outcomes, including dramatically increased death rate, when it is comorbid with other chronic diseases, notably, diabetes,12,13 cardiovascular disease,14,15 and pain.16,17 Major depressive disorder is a major cause of years lost to disability globally.18-21 Eighty percent of depressed people are impaired in their daily functioning,22 leading to loss of work productivity due to absenteeism and short-term disability.23-25 Therefore, misdiagnosis or a delay in diagnosis can have important personal, social, and economic impact.
Decades of research have indicated that MDD is accompanied by changes in the function of several biological systems. These functional changes are often accompanied by alterations in biomarkers within the inflammatory, hypothalamic-pituitary-adrenal (HPA) axis, metabolic, and/or neuroendocrine mediators and pathways.26-30 We previously developed a biomarker panel and a prediction algorithm as an aid to MDD diagnosis. The test consists of 9 nongenetic serum biomarkers and an algorithm. A thyroid-stimulating hormone level in sera is measured as part of the test panel but is not included in the algorithm and is reported separately. An MDDScore is the result of that test; it is presented as a single integer with a range from 1 to 9 and is provided as an aid to the diagnosis of MDD. The 9 biomarkers in the panel are associated with alterations in key pathways associated with unipolar depression.1,2,26-30 With a goal of evaluating these markers in an independent randomized population and the possibility of achieving increased performance, we initiated new prospective studies.

- Patients with depression often present initially to primary care physicians and may be triaged by their assistants and associates, who may lack the expertise necessary to evaluate depression.
- Current diagnosis of depression is based on patients’ accurately responding to clinicians’ questions, but in many situations this does not occur. In such settings, the MDDScore blood test may be especially helpful.
- This study confirms the utility of MDDScore, a 9-analyte serum biomarker panel and an algorithm, as an aid to MDD diagnosis.
METHOD
Study Participants
MDD patients. Study protocols were approved and monitored by the institutional review boards at the respective study centers. Three sites actively recruited outpatients: Massachusetts General Hospital (MGH; Boston, Massachusetts), Caritas Saint Elisabeth Medical Center (Brighton, Massachusetts), and Vanderbilt University School of Medicine (Nashville, Tennessee). Methods used for patient recruitment varied between sites; however, advertisements and clinician referrals were consistently utilized. Patients from MGH and Vanderbilt were part of a clinical study on escitalopram monotherapy. Written informed consent was obtained from all participants before any study procedures were performed. Male and female patients aged 18 to 75 years who met criteria for MDD according to the Diagnostic and Statistical Manual of Mental Disorders, Fourth Edition,31 as diagnosed with the use of the Structured Clinical Interview for DSM-IV Axis I Disorders32 and/or the Mini-International Neuropsychiatric Interview,33 were eligible for enrollment in the study. Exclusion criteria included the concurrent use of nonsteroidal anti-inflammatory agents, steroids, antidepressants, antipsychotic medications, and anticonvulsants at any time during the past 2 weeks; any lifetime history of mania or hypomania; any concurrent psychotic symptoms or alcohol or drug use disorders that were active during the past 3 months; pregnancy; and the presence of serious and/or unstable medical disorders, Addison or Cushing disease, rheumatoid arthritis, or systemic lupus erythematosus. Patients were also excluded if they had previously provided blood samples that were used for MDDScore or other testing at Ridge Diagnostics.
MDD patients were clinically evaluated using standard psychiatric assessment tools including structured clinical interviews and the HDRS-17. All MDD patients (n = 68) were screened and scored using the HDRS-17 while they were drug-free for a minimum of 2 weeks. Baseline HDRS rating scores for all patients were 9 to 30, ranging from mild to severe depression. The mean ± SD score was 19.62 ± 5.08, indicating that the MDD patients were predominantly within a moderate severity range. A subset of patients treated with escitalopram (10 or 20 mg) for a period of 8 weeks provided samples at 1 week (n = 21) or 8 weeks (n = 15).
Non-MDD volunteers. Samples from subjects without MDD were obtained from the Brain Institute of the University of Utah (n = 9) and the Department of Psychiatry, Caritas St Elisabeth Medical Center (Boston, Massachusetts) (n = 3) after subjects were evaluated with structured interviews and depression scales, which included HDRS-17 and/or Montgomery-Asberg Depression Rating Scale.34 Nondepressed volunteers were recruited from local sources in both San Diego, California (n = 9) and Durham, North Carolina (n = 35). Local nondepressed volunteers were evaluated using the Patient Health Questionnaire-9 (PHQ-9),35 and those individuals with a score < 5 were included as non-MDD subjects. Subjects with a PHQ-9 score of 5 or higher or those on antidepressant therapy for any reason were excluded from the study.
Non-MDD samples (n = 30) were also obtained from a commercial source (PrecisionMed; San Diego, California). To qualify for inclusion in the study, PrecisonMed subjects had an interview with a psychiatrist or other mental health professional and had to have no personal or family history of psychiatric, cognitive, or neurologic disease. All subject-related clinical data were stored at PrecisionMed. Serum samples were collected by PrecisionMed and stored at -80°C prior to shipment to the Ridge Diagnostics Laboratory (Research Triangle Park, North Carolina).
Sample Collection and Handling
After signing an informed consent statement, each study subject provided a blood sample, which was processed to collect serum. Each site prepared serum under standardized conditions. Briefly, blood was allowed to clot for 30 minutes, centrifuged 10 minutes at 1,300 ח g (relative centrifugal force) to collect serum that was aliquoted within 30 minutes of centrifugation, and frozen at -80°C until ready for shipment on dry ice to the Clinical Laboratory Improvement Amendments (CLIA)-certified Ridge Diagnostics Laboratory (Research Triangle Park, North Carolina). The date and time of the blood draw were noted by the study site for each sample. Serum was prepared from qualified participants in San Diego and then shipped frozen to the Ridge Diagnostics Laboratory. Serum samples from Durham were stored briefly at 4°C and transported by courier and frozen upon arrival to the Ridge Diagnostics Laboratory in that same area.
Calculations
Age, gender, height, and weight of each subject were recorded, and body mass index (BMI) was calculated using the formula BMI = (weight in pounds ×— 703)/(height in inches)2 and an online calculator (http://www.mayoclinic.org/bmi-calculator/itt-20084938).
Clinical sensitivity and specificity were calculated from each data set using an online clinical calculator based on a 2 ×— 2 table (http://www.vassarstats.net/clin1.html). Receiver operating characteristic (ROC) curves were also used to determine the test performance characteristics.
Serum Biomarker Assays
Previously, the 9 individual biomarkers measured in our study were selected from a broader panel of 33 biomarkers based on the difference in concentration for each marker between MDD patients and nondepressed control subjects from past samples.1,2 The same 9-member panel was tested, which greatly limited the possibility of “overfitting.” Serum levels of the 9 biomarkers in the MDDScore panel (α1 antitrypsin [A1AT], apolipoprotein C3 [ApoC3], brain-derived neurotrophic factor [BDNF], cortisol, epidermal growth factor [EGF], myeloperoxidase [MPO], prolactin [PRL], resistin [RETN], and soluble tumor necrosis factor α receptor type II [TNFR2]) were measured by individual quantitative immunoassays. Standard curves for calibrating the quantity of each biomarker were generated by serial dilution of each purified protein. The range of the standards for each assay was based on the Ridge Diagnostics Laboratory’s analysis of multiple samples to establish the standard distribution surrounding the concentrations found in the serum of male and female subjects. Gender-specific differences were observed for some analytes. Both A1AT and ApoC3 concentrations were measured by an analytically validated turbidimetric assay developed at the Ridge Diagnostics Laboratory. BDNF, TNFR2, and EGF levels were determined using Quantikine human ELISA kits from R&D Systems (Minneapolis, Minnesota). MPO was measured by a human serum ELISA kit obtained from ALPCO Immunoassays (Salem, New Hampshire). Prolactin in serum was measured using a human serum ELISA, and cortisol levels in serum were determined by use of a competition ELISA, both obtained from Monobind (Lake Forest, California). While the analytes were unchanged from previous studies, improved methods of detection were used.
Reference ranges for the individual biomarkers were determined from a set of 105 control sera from individuals not known to be depressed and obtained from a commercial source (BioReliance; Rockville, Maryland). The mean, SD, and ± 2 SD limits were calculated for each biomarker.
Cortisol Adjustments for Diurnal Variation
It is well known that serum cortisol levels undergo a diurnal variation, with levels reaching a peak between 6-8 am and gradually falling over the course of the day, reaching a lowest point around midnight. While the majority of subjects had their blood drawn for MDDScore testing in the late morning or early afternoon, when the decline in cortisol was linear, patients whose blood was drawn early in the day (particularly 30-45 minutes after awakening) had peak levels. To control for this variation, we developed a method to convert all cortisol values to a noontime equivalent using a concentration time curve derived from studies of diurnal variation in non-MDD subjects and MDD patients.36
Model Development
Early versions of the MDDScore algorithm, including the versions previously published,1,2 used the same markers but in a clinically less sophisticated and mathematically more complex form. Earlier algorithms did not take gender or BMI into account and did not normalize cortisol levels as was done in this study. We examined how well both a “full” logistic regression model and a reduced model obtained from the full model by means of stepwise regression (developed in the training data set) predicted MDD in the validation data set.
The full model is
diagnosis~gender+CORT2+BDNF+
log(MPO) + log(EGF) + gender*
(PRL + RETN + TNFR2 + BMI) + A1AT + APOC3
where X*Y directs the model to include an interaction term between the variables X and Y as well as those variables themselves, and X*(Y + Z) is shorthand for X*Y + X*Z. After examining the distributions of all variables and the correlations of all pairs of variables, we chose to log-transform MPO and EGF and include gender interactions for PRL, RETN, TNFR2, and BMI in the “full” model. CORT2 is the time-of-day-adjusted cortisol concentration that was used instead of the measured value.
RESULTS
Study Participants
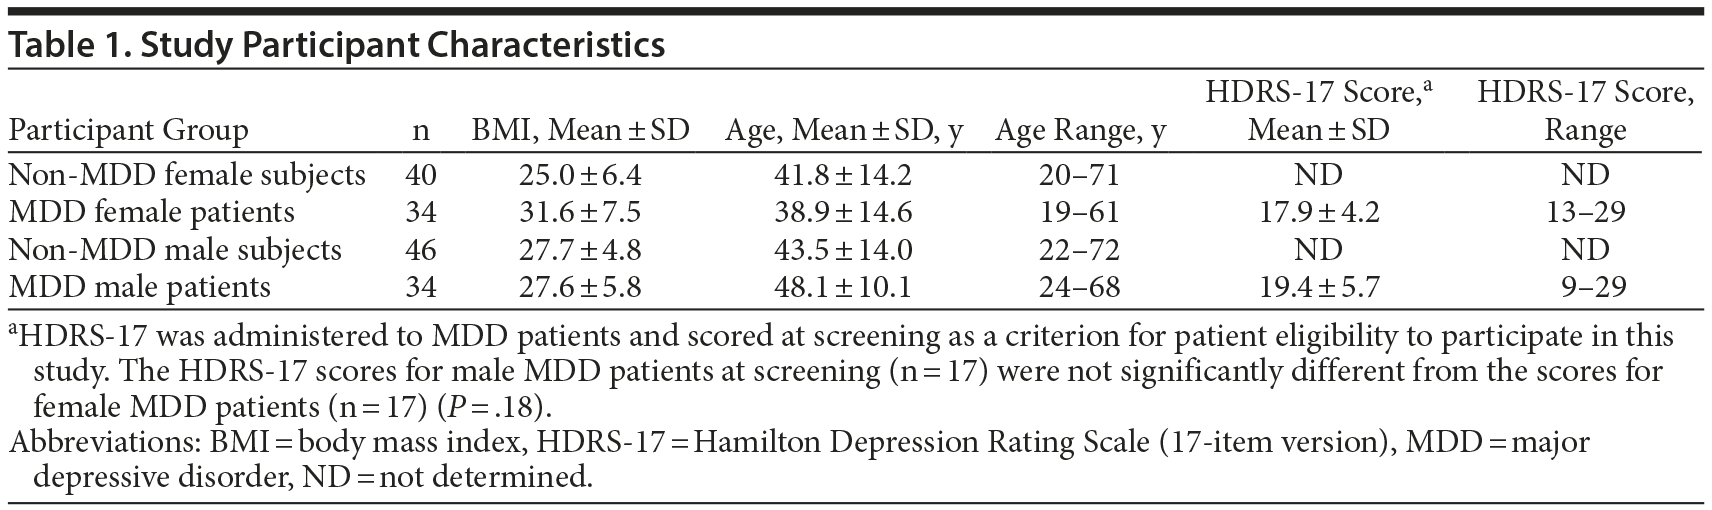
There were 154 samples in this study, 68 from MDD patients and 86 from non-MDD subjects. There were 40 non-MDD female and 46 non-MDD male subjects. The MDD population had samples from 34 female and 34 male patients. The age, gender, and BMI of the participants in this study are listed in Table 1.
Click figure to enlarge
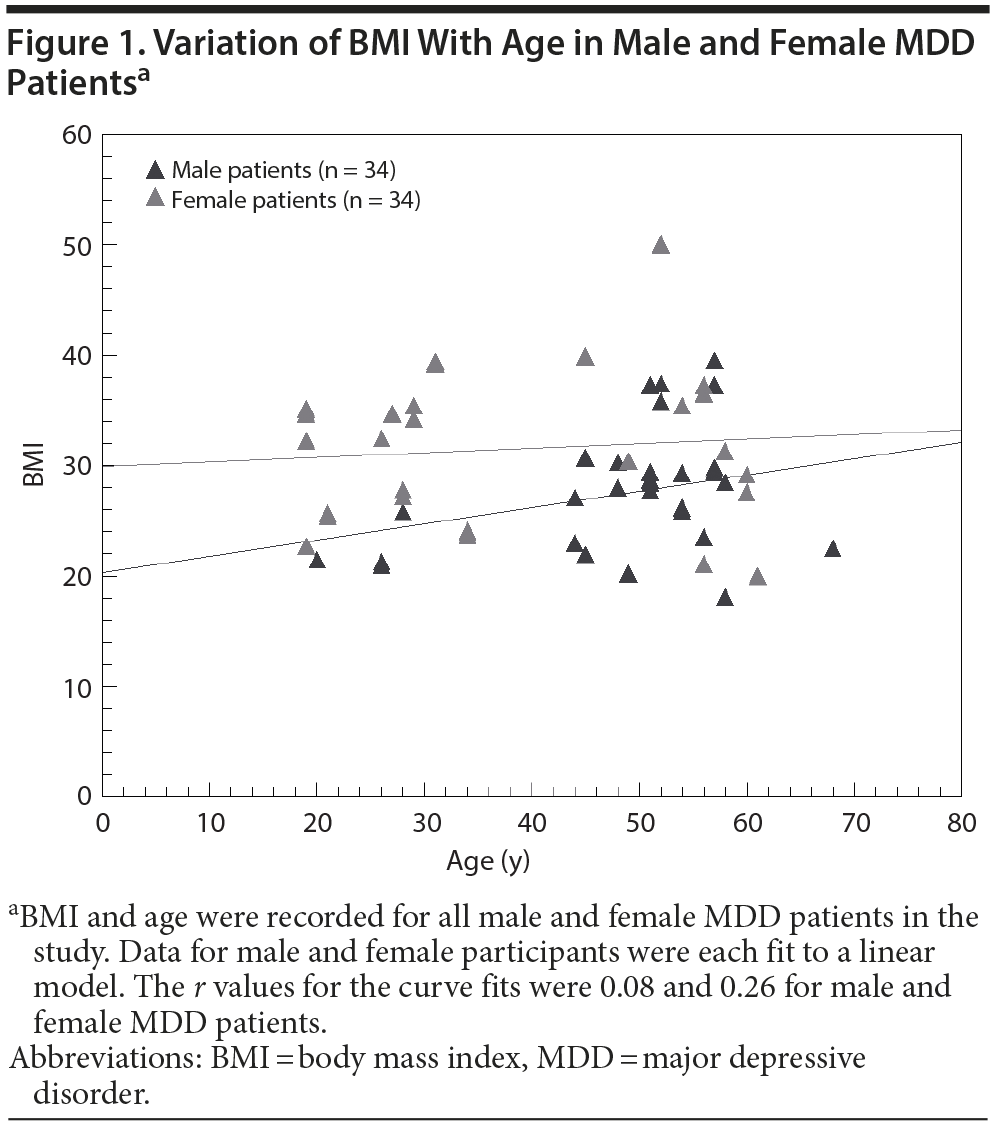
The BMIs for male MDD patients and nondepressed subjects were not significantly different (P = .97). The BMIs for female MDD patients were significantly higher than for nondepressed female subjects (P = .00015). Female MDD patients had a mean ± SD BMI of 31.6 ± 7.5, while their counterparts without MDD had a BMI of 25.0 ± 6.4. In addition, BMI had a tendency to increase steadily with age for male MDD participants, while the BMI of female MDD participants appeared to be fairly constant with age (Figure 1). In our study, female MDD patients below 40 years of age had higher mean ± SD BMI (30.1 ± 5.7) than their female counterparts without MDD (25.1 ± 7.1), which was statistically significant (P = .03).
Click figure to enlarge
Derivation of an MDDScore Algorithm Including Gender and BMI
In order to avoid potential bias, the MDD and non-MDD groups were randomized as described in this section. To reduce the potential for model overfitting, two-thirds of the study participants (n = 102) were randomly assigned to a model derivation data set (the “training set”), and one-third (n = 52) were reserved as an independent validation data set. Randomization was performed as follows: Subjects were first stratified by clinical diagnosis (non-MDD, MDD) and gender (male, female). The resulting 4 groups were sorted by age, and a random number was assigned to each sample. For every 3 samples in the age-sorted order, the one with the highest random number was assigned to the validation set, and the remaining 2 were allocated to the training set. The resulting training set consisted of 58 non-MDD samples and 44 MDD samples. With regard to gender, there were 52 male samples and 50 female samples in the training set. Biomarker data from the training set were used to develop the algorithmic models, which were then applied to the validation set. The validation set, used for model confirmation, was samples from 24 MDD patients and 28 non-MDD subjects and was composed of 28 male and 24 female samples.
Clinical Performance of the New Algorithm
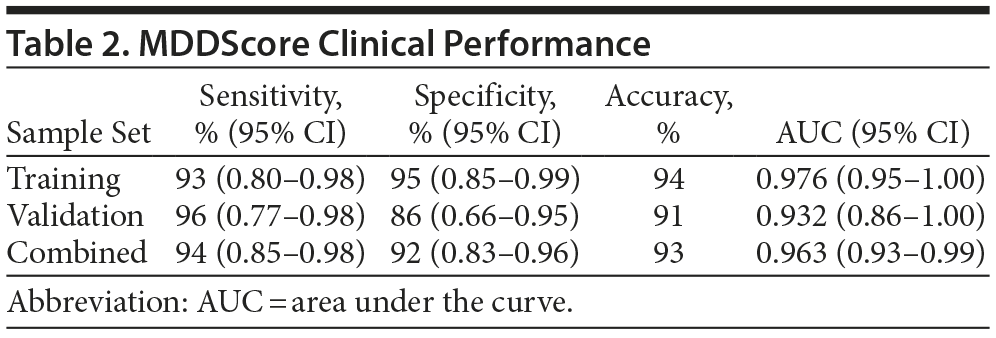
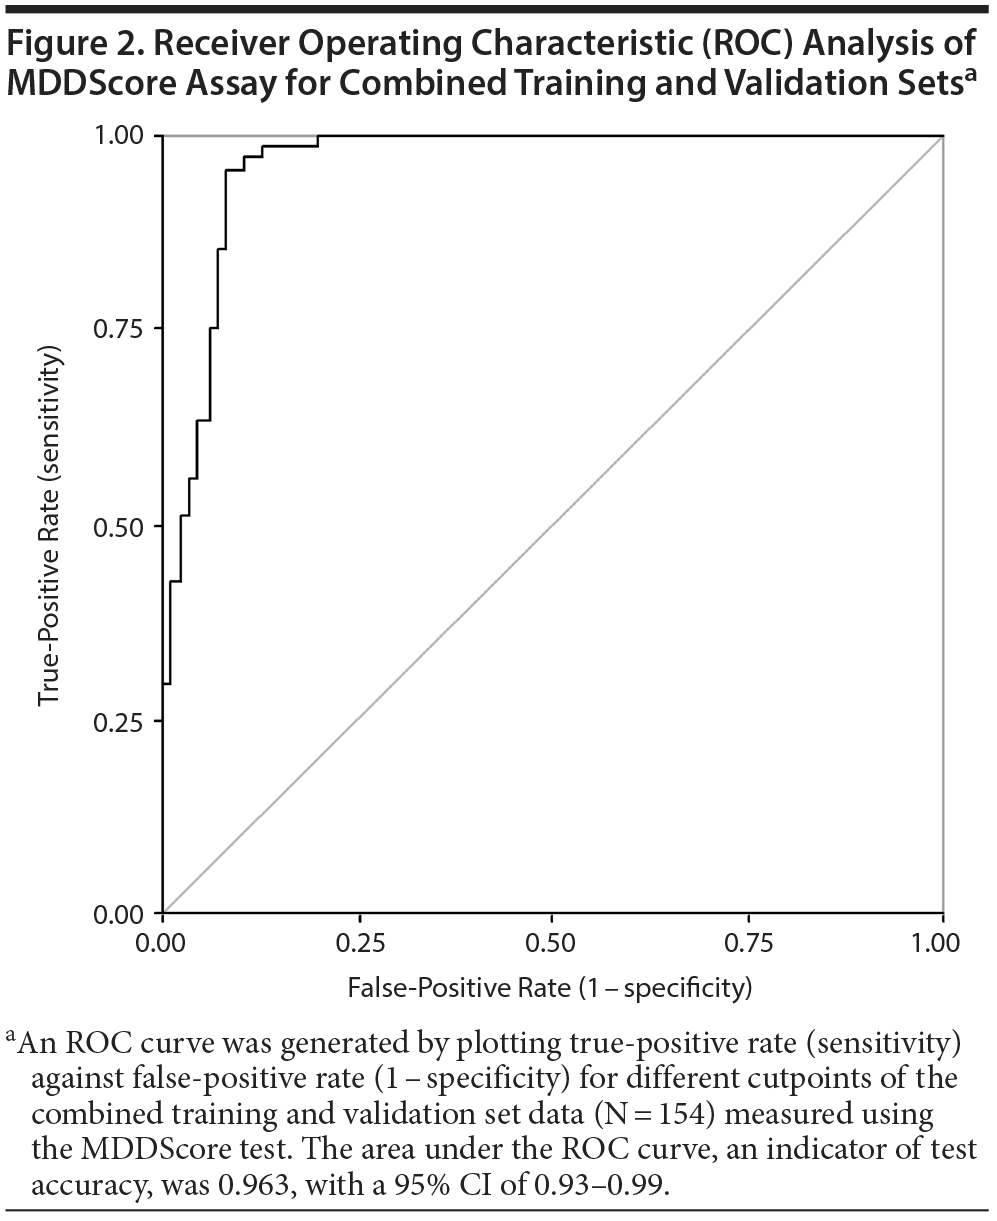
The performance of the test panel was evaluated statistically by determining the clinical sensitivity and specificity. We used both a clinical calculator based on a 2 ×— 2 table (http://www.vassarstats.net/clin1.html) and ROC curves to determine the test performance characteristics. The performance of the new model using the training, validation, and combined datasets is shown in Table 2. The sensitivity and specificity of the model applied to the training set were 93% and 95%, respectively. In analysis of the validation set, sensitivity and specificity were 96% and 86%, respectively. When the 2 datasets were combined, the model had a sensitivity and a specificity of 94% and 92%, respectively. The accuracy of the test was calculated using the formula (true-positive + true-negative) divided by (the sum of all disease positive and negative). Accuracy ranged from 91%-94% depending on the dataset. The area under the ROC curve for the MDDScore test on the combined dataset model is 0.963 (95% CI, 0.93-0.99) (Figure 2).
Click figure to enlarge
Click figure to enlarge
The confidence intervals for area under the curve (AUC) overlap when the training and validation sets are compared. The apparently higher sensitivity and lower specificity in the validation set are believed to be due to randomness; the results were essentially the same, and the combined set is suggested as the most accurate measure of performance, as it includes a larger population. However, out of greater caution, the validation set data, in which the test accuracy was 91%, might be emphasized.
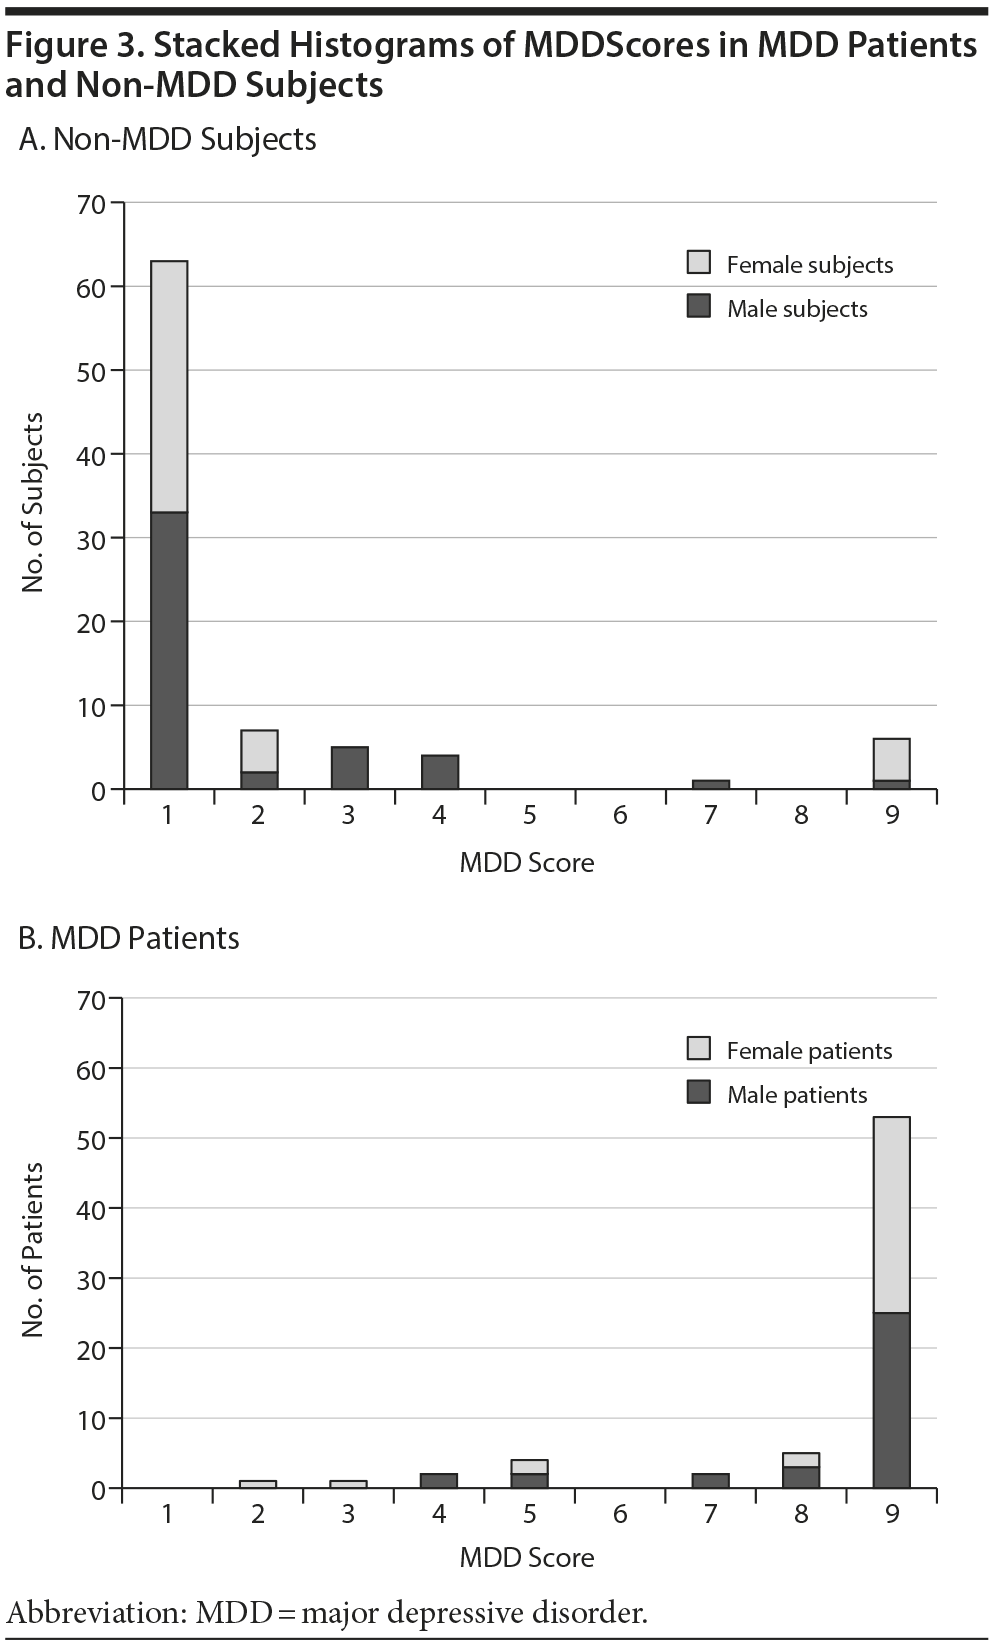
Figure 3 shows the test performance in male and female subjects. Figure 3A contains all of the subjects without MDD; they typically have low MDDScores (mean ± SD = 1.6 ± 2.0). The MDD patients (Figure 3B) typically had high MDDScores (7.9 ± 1.9; P ≤ .00001).
Click figure to enlarge
As was previously indicated, a substantial proportion of the patients were treated with escitalopram (10 or 20 mg) for a period of 8 weeks, and they provided samples at 1 week (n = 21) or 8 weeks (n = 15). The mean HDRS-17 score for all patients at baseline was 18.7 ± 5.0, which was not statistically different from HDRS-17 scores of patients treated for 1 week (16.9 ± 5.6; P = .24). However, the HDRS-17 scores for all patients at baseline were statistically different from the scores of patients treated for 8 weeks (13.9 ± 5.0; P = .006). In contrast, the MDDScores for patients treated for 1 week (8.0 ± 1.3) or 8 weeks (7.2 ± 3.2) were not statistically different from the MDDScores at baseline (7.3 ± 2.4; P = .22 and P = .89, respectively).
DISCUSSION
In the past decade, there has been increasing interest in incorporating biomarkers into psychiatry, with the hope that biological indicators will improve psychiatric diagnoses by underpinning them with physiologic evidence. This change has already occurred in most fields of medicine, in which, typically, a laboratory test confirms a clinical diagnosis. This kind of confirmation is challenging in psychiatry, as the clinical diagnosis includes a number of subcategories, and the information provided by measurement of a single biomarker usually has little predictive value when diverse populations are examined, even when they initially appear promising.2 However, a panel of biomarkers can be a useful predictor of disease diagnosis or stage.37 In contrast to single markers, multiple biomarkers serve to reduce the impact of variation between populations and subgroups. Prior work from our laboratory chose a panel of 9 biomarkers and determined the diagnostic performance of a multianalyte, serum-based test in 2 independent samples of patients with MDD, a test set (n = 36) and a validation set (n = 34), which were both compared to a single set of subjects without MDD (n = 46).1 In those earlier studies, the test panel demonstrated an overall sensitivity and specificity of 92% (95% CI, 0.76-0.98) and 81% (95% CI, 0.66-0.91), respectively.
To further test the published 9-marker panel, this prospective study used a somewhat larger set of MDD patients (n = 68) and a similarly collected set (n = 86) of non-MDD samples that were not part of the sample utilized in the previous study.1 In addition, when compared to those in the previous studies, the non-MDD population was more diverse in age and BMI and came from diverse regions across the United States (California, Massachusetts, and North Carolina).
In this study, clinical data on both gender and BMI were included as interaction terms in the algorithmic model. We, and others,38,39 have observed gender-specific differences in the serum concentration ranges of individual hormones and other biomarkers. Gender effects have been specifically noted for biomarkers on the MDDScore panel, including prolactin,40,41 cortisol,42,43 and TNFR2 (L.M.T., J.A.B. [Ridge Diagnostics]; unpublished data; 2013).
The association between obesity and depression has repeatedly been established.44-50 BMI has been considered as one measure of obesity and to be independent of age, gender, and ethnicity51,52; therefore, we investigated the impact of BMI on the algorithm. Similar to other results, the association between obesity and MDD was found in women but not significantly in men.53 We found that the BMI for female MDD participants was significantly higher than for female subjects without MDD (P = .00015), while there was essentially no difference in BMI between male MDD patients and non-MDD subjects (P = .97).
In terms of potential mechanisms, obesity can be seen as an inflammatory state,54-56 and inflammation in turn has been associated with depression and may be the mediator of the association.57,58 Obese women expressed approximately 6-fold more TNFR2 in circulation relative to lean control subjects.59 The HPA axis may also play a role in the relationship between obesity and depression, since dysregulation in the HPA axis has been related to abdominal obesity,60 and HPA axis dysregulation is involved in depression.61,62 As indicated by Stetler and Miller,62 cortisol is a hormone that can induce visceral/central adiposity, insulin resistance, dyslipidemia, and hypertension, all of which are metabolic precursors to type 2 diabetes. Therefore, HPA dysregulation may provide an additional explanatory link between depression and type 2 diabetes. In addition, adipose tissue development requires both proliferation and differentiation of adipocyte precursor cells. EGF, which is elevated in MDD patients, is a potent mitogen for pre-adipocytes, possibly further contributing to adipogenesis.63 Our observation of increased BMI in women with MDD also correlates with studies by Cizza and coworkers,36 who found that, compared with control subjects, women with MDD exhibited greater BMI, waist-to-hip ratio, and whole body and abdominal fat mass. At least 1 study in middle-aged men suggested that waist-to-hip ratio and not BMI was associated with symptoms of depression.64 The lack of concordance of BMI with MDD in men is consistent with our observations. However, since we did not record waist-to-hip measurements in this study, we cannot directly answer the question as to whether the significance of elevated BMI in female MDD participants was related to an increased frequency of central adiposity.
The interaction terms in the algorithm result in excellent performance in both male and female MDD patients regardless of high or low BMI (Figure 3). We also examined models that did not include BMI and gender. While these also gave satisfactory results, consistent with our previous publications, the models including BMI and gender appeared to perform better, especially on subpopulations such as young women. Similarly, the full regression as opposed to the stepwise model appeared more robust, but proof of superiority would require much larger studies designed to address specific questions. However, it is clear that high sensitivity and specificity, as well as robustness, are properties of the models we examined that use the 9 biomarkers. The model including gender and BMI resulted in the highest calculated accuracy.
Cortisol is the main adrenal glucocorticoid and plays a central role in glucose metabolism and in the response of the body to stress. Increased plasma cortisol in patients with major depression is a well-documented finding, although it is present in only 25%-30% of subjects with major depression.65 Serum and salivary cortisol levels follow a distinct diurnal pattern. While alterations of the HPA axis in depression are a reliable finding observed during depressive episodes and appear to be proportional in severity, there are no clear cutoff values for HPA biomarkers that were indicative that a subject has MDD. Thus, in order to provide optimal and reproducible measures of HPA functionality, a correction for cortisol diurnal variation in serum was implemented.
One of the major limitations to this and other studies of biomarkers involved with neuropsychiatric diseases is that both the diseased and nondiseased populations are operationally defined by clinical diagnostic parameters that can be subjective in nature. In addition, it has been difficult to categorize such disorders precisely due to the spectrum of symptoms and severity. Comorbidities including chronic pain, metabolic syndrome, diabetes, and cardiovascular disease can also be problematic for biomarker analysis, albeit a multianalyte panel and algorithm may minimalize the effect of some shared biomarkers. Further complicating physiologic approaches is the presence of multiple clinical subtypes of depression (eg, melancholic and atypical), which appear to exhibit different neuroendocrine, endocrine, and metabolic features.36 However, the pattern of biomarker expression and the information derived from analysis can be a physiologic statement about the probability that a condition exists or will develop. The MDDScore has a greater than 90% chance of characterizing an MDD patient as having the disease. It also has a greater than 90% chance of characterizing a person without MDD as not having MDD. The test has not been evaluated as a screening test, but it has excellent performance in confirming a diagnosis of MDD. As a diagnostic aid, it has proved useful in managing patients in clinical psychiatric practices, particularly in terms of acceptance of a diagnosis.66 While biomarkers and models provide clinically useful indicators of MDD, we cannot rule out the possibility that the spectrum of MDD symptomatology and severity, as well as factors we have not tested for, will present some degree of uncertainty. The use of a panel of markers and the inclusion of BMI and gender parameters resulted in accurate diagnosis of a diverse population. The test was accurate for patients taking antidepressants (54.4% of the MDD patients in this study were on treatment with antidepressants) as well as in our earlier studies of drug-free patients.1,2 While HDRS-17 scores at 8 weeks were significantly different from baseline, MDDScores for patients treated for 1 week (8.0 ± 1.3) or 8 weeks (7.2 ± 3.2) were not statistically different from the MDDScores at baseline (7.3 ± 2.4; P = .22 and P = .89, respectively).
Nondepressed subjects and MDD patients generally cluster at the far ends of the MDDScore continuum (Figure 3). Few participants have intermediated scores. Thus, interpretation is clear, and the exact cutoff does not significantly alter sensitivity and specificity. The reason why a few subjects’ scores did not appear consistent with the clinical evaluation is not clear.
While all laboratory tests have some false-negatives and false-positives, the performance characteristics of the MDDScore compare very favorably with those of tests that are currently in use for other conditions. The AUC is typically used for such comparison. The MDDScore (AUC, 0.93-0.97) is very favorable when compared to other diagnostic tests. For example, the current generation of cardiac enzymes used clinically to evaluate patients for acute myocardial infarction has AUCs in only the 0.8-0.85 range.67,68 Thus, the performance of the MDDScore is sufficiently high to justify widespread use; it is likely to be as useful as tests commonly used for other medical conditions and will allow biochemical confirmation of what is currently a subjective diagnosis.
Drug names: escitalopram (Lexapro and others).
Author affiliations: Research & Development, Ridge Diagnostics Inc, Research Triangle Park, North Carolina (Drs Bilello and Thurmond); Research & Development, Ridge Diagnostics, San Diego, California (Drs Smith and Pi); Department of Mathematics, Whittier College, Whittier, California (Dr Rubin); Research & Development, FindCure, Aurora, Colorado (Drs Wright and Taub); Department of Psychiatry, Massachusetts General Hospital, Boston (Drs Henry and Papakostas); and Department of Psychiatry, University of Alabama Birmingham School of Medicine, Birmingham (Dr Shelton).
Potential conflicts of interest: Drs Bilello and Thurmond are stockholders in and employed by Ridge Diagnostics. Dr Smith is an employee of Ridge Diagnostics. Dr Pi is a stockholder in Ridge Diagnostics and was an employee at the time of this study. Drs Rubin, Wright, and Taub are consultants to Ridge Diagnostics. Drs Henry, Shelton, and Papakostas are consultants to and members of the Clinical Advisory Board of Ridge Diagnostics.
Funding/support: This study was supported by Ridge Diagnostics Inc.
Previous presentation: This study was presented in part at the Society of Biological Psychiatry 68th Annual Scientific Convention; May 16-18, 2013; San Francisco, California.
Acknowledgments: The authors acknowledge the excellent technical support of Laurie Rotchford and Nathaniel Hall, who performed the biomarker testing and analysis of serum samples while employees of Ridge Diagnostics. In addition, they acknowledge the participation of both the MDD patients and the volunteers who provided samples for this study.
REFERENCES
1. Papakostas GI, Shelton RC, Kinrys G, et al. Assessment of a multi-assay, serum-based biological diagnostic test for major depressive disorder: a pilot and replication study. Mol Psychiatry. 2013;18(3):332-339. PubMed doi:10.1038/mp.2011.166
2. Smith KM, Renshaw PF, Bilello JA. The diagnosis of depression: current and emerging methods. Compr Psychiatry. 2013;54(1):1-6. PubMed doi:10.1016/j.comppsych.2012.06.006
3. Faraone SV, Tsuang MT. Measuring diagnostic accuracy in the absence of a “gold standard.” Am J Psychiatry. 1994;151(5):650-657. PubMed
4. Ramirez Basco M, Bostic JQ, Davies D, et al. Methods to improve diagnostic accuracy in a community mental health setting. Am J Psychiatry. 2000;157(10):1599-1605. PubMed doi:10.1176/appi.ajp.157.10.1599
5. Tiemens BG, VonKorff M, Lin EH. Diagnosis of depression by primary care physicians versus a structured diagnostic interview: understanding discordance. Gen Hosp Psychiatry. 1999;21(2):87-96. PubMed doi:10.1016/S0163-8343(98)00077-2
6. Rettew DC, Lynch AD, Achenbach TM, et al. Meta-analyses of agreement between diagnoses made from clinical evaluations and standardized diagnostic interviews. Int J Methods Psychiatr Res. 2009;18(3):169-184. PubMed doi:10.1002/mpr.289
7. Beck AT, Ward CH, Mendelson M, et al. An inventory for measuring depression. Arch Gen Psychiatry. 1961;4(6):561-571. PubMed doi:10.1001/archpsyc.1961.01710120031004
8. Hamilton M. A rating scale for depression. J Neurol Neurosurg Psychiatry. 1960;23(1):56-62. PubMed doi:10.1136/jnnp.23.1.56
9. Keller MB, Hirschfeld RM, Demyttenaere K, et al. Optimizing outcomes in depression: focus on antidepressant compliance. Int Clin Psychopharmacol. 2002;17(6):265-271. PubMed doi:10.1097/00004850-200211000-00001
10. Sheline YI, Gado MH, Kraemer HC. Untreated depression and hippocampal volume loss. Am J Psychiatry. 2003;160(8):1516-1518. PubMed doi:10.1176/appi.ajp.160.8.1516
11. Gualtieri CT, Johnson LG, Benedict KB. Neurocognition in depression: patients on and off medication versus healthy comparison subjects. J Neuropsychiatry Clin Neurosci. 2006;18(2):217-225. PubMed doi:10.1176/appi.neuropsych.18.2.217
12. Lustman PJ, Clouse RE. Treatment of depression in diabetes: impact on mood and medical outcome. J Psychosom Res. 2002;53(4):917-924. PubMed doi:10.1016/S0022-3999(02)00416-6
13. Eaton WW. Epidemiologic evidence on the comorbidity of depression and diabetes. J Psychosom Res. 2002;53(4):903-906. PubMed doi:10.1016/S0022-3999(02)00302-1
14. Nemeroff CB, Goldschmidt-Clermont PJ. Heartache and heartbreak—the link between depression and cardiovascular disease. Nat Rev Cardiol. 2012;9(9):526-539. PubMed doi:10.1038/nrcardio.2012.91
15. Frasure-Smith N, Lespérance F. Recent evidence linking coronary heart disease and depression. Can J Psychiatry. 2006;51(12):730-737. PubMed
16. Robinson MJ, Edwards SE, Iyengar S, et al. Depression and pain. Front Biosci (Landmark Ed). 2009;14(1):5031-5051. PubMed doi:10.2741/3585
17. Bair MJ, Robinson RL, Katon W, et al. Depression and pain comorbidity: a literature review. Arch Intern Med. 2003;163(20):2433-2445. PubMed doi:10.1001/archinte.163.20.2433
18. Becker AE, Kleinman A. Mental health and the global agenda. N Engl J Med. 2013;369(1):66-73. doi:10.1056/nejmra1110827 PubMed
19. Vos T, Flaxman AD, Naghavi M, et al. Years lived with disability (YLDs) for 1160 sequelae of 289 diseases and injuries 1990-2010: a systematic analysis for the Global Burden of Disease Study 2010. Lancet. 2012;380(9859):2163-2196. PubMed doi:10.1016/S0140-6736(12)61729-2
20. Stewart WF, Ricci JA, Chee E, et al. Cost of lost productive work time among US workers with depression. JAMA. 2003;289(23):3135-3144. PubMed doi:10.1001/jama.289.23.3135
21. Pratt LA, Brody DJ. Depression in the United States Household Population, 2005-2006 NCHS Data Brief, No.7. Hyattsville, MD: National Center for Health Statistics; 2008.
22. Kessler RC, Barber C, Birnbaum HG, et al. Depression in the workplace: effects on short-term disability. Health Aff (Millwood). 1999;18(5):163-171. PubMed doi:10.1377/hlthaff.18.5.163
23. Druss BG, Schlesinger M, Allen HM Jr. Depressive symptoms, satisfaction with health care, and 2-year work outcomes in an employed population. Am J Psychiatry. 2001;158(5):731-734. PubMed doi:10.1176/appi.ajp.158.5.731
24. Adler DA, McLaughlin TJ, Rogers WH, et al. Job performance deficits due to depression. Am J Psychiatry. 2006;163(9):1569-1576. PubMed doi:10.1176/appi.ajp.163.9.1569
25. Greener MJ, Guest JF. Do antidepressants reduce the burden imposed by depression on employers? CNS Drugs. 2005;19(3):253-264. PubMed doi:10.2165/00023210-200519030-00006
26. Shelton RC. The molecular neurobiology of depression. Psychiatr Clin North Am. 2007;30(1):1-11. PubMed doi:10.1016/j.psc.2006.12.005
27. Kenis G, Maes M. Effects of antidepressants on the production of cytokines. Int J Neuropsychopharmacol. 2002;5(4):401-412. PubMed doi:10.1017/S1461145702003164
28. Maes M. Major depression and activation of the inflammatory response system. In: Dantzer R, Wollman EE, Yirmiya R, eds. Cytokines, Stress and Depression. New York, NY: Kluwer Academic/Plenum Publishers; 1999:25-46. doi:10.1007/978-0-585-37970-8_2
29. Zhu CB, Blakely RD, Hewlett WA. The proinflammatory cytokines interleukin-1beta and tumor necrosis factor-alpha activate serotonin transporters. Neuropsychopharmacology. 2006;31(10):2121-2131. PubMed
30. Tichomirowa MA, Keck ME, Schneider HJ, et al. Endocrine disturbances in depression. J Endocrinol Invest. 2005;28(3):89-99. PubMed doi:10.1007/BF03345535
31. American Psychiatric Association. Diagnostic and Statistical Manual of Mental Disorders, Fourth Edition, Text Revision. Washington, DC: American Psychiatric Association; 2000.
32. First MB, Spitzer RL, Gibbon M, et al. Structured Clinical Interview for DSM-IV Axis I Disorders (SCID-I), Clinician Version, Administration Booklet. Washington, DC: American Psychiatric Pub.; 2012.
33. Sheehan DV, Lecrubier Y, Sheehan KH, et al. The Mini-International Neuropsychiatric Interview (M.I.N.I.): the development and validation of a structured diagnostic psychiatric interview for DSM-IV and ICD-10. J Clin Psychiatry. 1998;59(suppl 20):22-33, quiz 34-57. PubMed
34. Montgomery SA, Asberg M. A new depression scale designed to be sensitive to change. Br J Psychiatry. 1979;134(4):382-389. PubMed doi:10.1192/bjp.134.4.382
35. Kroenke K, Spitzer RL. The PHQ-9: a new depression diagnostic and severity measure. Psychiatr Ann. 2002;32(9):509-515. doi:10.3928/0048-5713-20020901-06
36. Cizza G, Ronsaville DS, Kleitz H, et al; P.O.W.E.R. (Premenopausal, Osteopenia/Osteoporosis, Women, Alendronate, Depression) Study Group. Clinical subtypes of depression are associated with specific metabolic parameters and circadian endocrine profiles in women: the POWER study. PLoS ONE. 2012;7(1):e28912. PubMed doi:10.1371/journal.pone.0028912
37. Kumar M, Sarin SK. Biomarkers of diseases in medicine. Curr Trends Sci. 2009; 403-417. http://www.ias.ac.in/pubs/splpubs/pjubileebook/403.pdf. Accessed December 8, 2014.
38. Torjesen PA, Sandnes L. Serum testosterone in women as measured by an automated immunoassay and a RIA. Clin Chem. 2004;50(3):678-679, author reply 678-679. PubMed doi:10.1373/clinchem.2003.027565
39. Gender Identity Disorder Information. GID.info. Hormone therapy hormone references: normal male and female reference levels. http://www.hemingways.org/GIDinfo/hrt_ref.htm. Accessed December 9, 2014.
40. Guyda HJ, Friesen HG. Serum prolactin levels in humans from birth to adult life. Pediatr Res. 1973;7(5):534-540. PubMed doi:10.1203/00006450-197305000-00007
41. Meltzer HY, Piyakalmala S, Schyve P, et al. Lack of effect of tricyclic antidepressants on serum prolactin levels. Psychopharmacology (Berl). 1977;51(2):185-187. PubMed doi:10.1007/BF00431738
42. Van Cauter E, Leproult R, Kupfer DJ. Effects of gender and age on the levels and circadian rhythmicity of plasma cortisol. J Clin Endocrinol Metab. 1996;81(7):2468-2473. PubMed
43. Seeman TE, Singer B, Wilkinson CW, et al. Gender differences in age-related changes in HPA axis reactivity. Psychoneuroendocrinology. 2001;26(3):225-240. PubMed doi:10.1016/S0306-4530(00)00043-3
44. Stunkard AJ, Faith MS, Allison KC. Depression and obesity. Biol Psychiatry. 2003;54(3):330-337. PubMed doi:10.1016/S0006-3223(03)00608-5
45. de Wit L, Luppino F, van Straten A, et al. Depression and obesity: a meta-analysis of community-based studies. Psychiatry Res. 2010;178(2):230-235. PubMed doi:10.1016/j.psychres.2009.04.015
46. Luppino FS, de Wit LM, Bouvy PF, et al. Overweight, obesity, and depression: a systematic review and meta-analysis of longitudinal studies. Arch Gen Psychiatry. 2010;67(3):220-229. PubMed doi:10.1001/archgenpsychiatry.2010.2
47. de Wit LM, van Straten A, van Herten M, et al. Depression and body mass index, a U-shaped association. BMC Public Health. 2009;9:14. PubMed doi:10.1186/1471-2458-9-14
48. Faith MS, Matz PE, Jorge MA. Obesity-depression associations in the population. J Psychosom Res. 2002;53(4):935-942. PubMed doi:10.1016/S0022-3999(02)00308-2
49. Scott KM, McGee MA, Wells JE, et al. Obesity and mental disorders in the adult general population. J Psychosom Res. 2008;64(1):97-105. PubMed doi:10.1016/j.jpsychores.2007.09.006
50. Simon GE, Ludman EJ, Linde JA, et al. Association between obesity and depression in middle-aged women. Gen Hosp Psychiatry. 2008;30(1):32-39. PubMed doi:10.1016/j.genhosppsych.2007.09.001
51. Keys A, Fidanza F, Karvonen MJ, et al. Indices of relative weight and obesity. J Chronic Dis. 1972;25(6):329-343. PubMed doi:10.1016/0021-9681(72)90027-6
52. Deurenberg P, Weststrate JA, Seidell JC. Body mass index as a measure of body fatness: age- and sex-specific prediction formulas. Br J Nutr. 1991;65(2):105-114. PubMed doi:10.1079/BJN19910073
53. Onyike CU, Crum RM, Lee HB, et al. Is obesity associated with major depression? results from the Third National Health and Nutrition Examination Survey. Am J Epidemiol. 2003;158(12):1139-1147. PubMed doi:10.1093/aje/kwg275
54. Dandona P, Aljada A, Bandyopadhyay A. Inflammation: the link between insulin resistance, obesity and diabetes. Trends Immunol. 2004;25(1):4-7. PubMed doi:10.1016/j.it.2003.10.013
55. Zeyda M, Stulnig TM. Obesity, inflammation, and insulin resistance—a mini-review. Gerontology. 2009;55(4):379-386. PubMed doi:10.1159/000212758
56. Gregor MF, Hotamisligil GS. Inflammatory mechanisms in obesity. Annu Rev Immunol. 2011;29(1):415-445. PubMed doi:10.1146/annurev-immunol-031210-101322
57. Vaccarino V, Johnson BD, Sheps DS, et al; National Heart, Lung, and Blood Institute. Depression, inflammation, and incident cardiovascular disease in women with suspected coronary ischemia: the National Heart, Lung, and Blood Institute-sponsored WISE study. J Am Coll Cardiol. 2007;50(21):2044-2050. PubMed doi:10.1016/j.jacc.2007.07.069
58. Hotamisligil GS, Arner P, Atkinson RL, et al. Differential regulation of the p80 tumor necrosis factor receptor in human obesity and insulin resistance. Diabetes. 1997;46(3):451-455. PubMed doi:10.2337/diab.46.3.451
59. Fernández-Real JM, Broch M, Ricart W, et al. Plasma levels of the soluble fraction of tumor necrosis factor receptor 2 and insulin resistance. Diabetes. 1998;47(11):1757-1762. PubMed doi:10.2337/diabetes.47.11.1757
60. Pasquali R, Vicennati V. Activity of the hypothalamic-pituitary-adrenal axis in different obesity phenotypes. Int J Obes Relat Metab Disord. 2000;24(suppl 2):S47-S49. PubMed doi:10.1038/sj.ijo.0801277
61. Pariante CM, Lightman SL. The HPA axis in major depression: classical theories and new developments. Trends Neurosci. 2008;31(9):464-468. PubMed doi:10.1016/j.tins.2008.06.006
62. Stetler C, Miller GE. Depression and hypothalamic-pituitary-adrenal activation: a quantitative summary of four decades of research. Psychosom Med. 2011;73(2):114-126. PubMed doi:10.1097/PSY.0b013e31820ad12b
63. Siddiqui S, Fang M, Ni B, et al. Central role of the EGF receptor in neurometabolic aging. Int J Endricrinol. 2012;2012:1-14. doi:10.1155/2012/739428
64. Rosmond R, Lapidus L, M×¥rin P, et al. Mental distress, obesity and body fat distribution in middle-aged men. Obes Res. 1996;4(3):245-252. PubMed doi:10.1002/j.1550-8528.1996.tb00542.x
65. Young EA, Carlson NE, Brown MB. Twenty-four-hour ACTH and cortisol pulsatility in depressed women. Neuropsychopharmacology. 2001;25(2):267-276. PubMed doi:10.1016/S0893-133X(00)00236-0
66. Bilello JA, Thurmond LM, Hall N, et al. Clinician Acceptance and Utility of a Multianalyte Biomarker Panel for Major Depressive Disorder (MDD) Diagnosis. US Psychiatric and Mental Health Congress; November 18-21, 2010; Orlando, FL.
67. Colak E, Mutlu F, Bal C, et al. Comparison of semiparametric, parametric, and nonparametric ROC analysis for continuous diagnostic tests using a simulation study and acute coronary syndrome data. Comput Math Methods Med. 2012;2012:698320. PubMed doi:10.1155/2012/698320
68. Collinson PO, Stubbs PJ, Kessler A-C; Multicentre Evaluation Of Routine Immunoassay Of Troponin T Study. Multicentre evaluation of the diagnostic value of cardiac troponin T, CK-MB mass, and myoglobin for assessing patients with suspected acute coronary syndromes in routine clinical practice. Heart. 2003;89(3):280-286. PubMed doi:10.1136/heart.89.3.280
Download Free PDF
This PDF is free for all visitors!