Finasteride and dutasteride are 5α-reductase inhibitor drugs that are used to treat benign prostatic hyperplasia (BPH). Randomized controlled trials (RCTs) conducted in men with BPH show that these drugs impair libido and cause erectile dysfunction. Meta-analyses of the RCTs confirm the findings, estimating odds ratio (OR) values for these adverse effects at around 1.50. A problem with meta-analyses that do not report absolute risks with drug vs placebo and that extract ORs instead of relative risks (RRs) from RCT data is that it is hard for the reader to know how to interpret the findings and communicate them to patients. Had the RR been 1.50, the reader would conclude that the risk with drug is 50% higher than the risk with placebo; this is easily understood because the risk with placebo would be available from the RCTs. In contrast, an OR of 1.50 means that the odds with drug are 50% higher than the odds with placebo; understanding this requires a knowledge of what the odds with placebo are as well as an understanding of what odds mean. Odds are not as easily understood as risks are. Odds are numerically different from risks, and the OR is numerically different from the RR. The difference between the OR and the RR is numerically small when the risks are similar in the two groups and also when the risks are dissimilar but the risk is small in the group of interest. The difference between the OR and the RR becomes increasingly large when the risks are dissimilar in the two groups and when the risk in the group of interest is not small. Smallness of risk, in this context, has been conservatively stated as 10%, but it could be possible to use a higher cutoff, such as 20%. Other issues related to risk, odds, RR, and OR are also discussed.
ABSTRACT
Finasteride and dutasteride are 5α-reductase inhibitor drugs that are used to treat benign prostatic hyperplasia (BPH). Randomized controlled trials (RCTs) conducted in men with BPH show that these drugs impair libido and cause erectile dysfunction. Meta-analyses of the RCTs confirm the findings, estimating odds ratio (OR) values for these adverse effects at around 1.50. A problem with meta-analyses that do not report absolute risks with drug vs placebo and that extract ORs instead of relative risks (RRs) from RCT data is that it is hard for the reader to know how to interpret the findings and communicate them to patients. Had the RR been 1.50, the reader would conclude that the risk with drug is 50% higher than the risk with placebo; this is easily understood because the risk with placebo would be available from the RCTs. In contrast, an OR of 1.50 means that the odds with drug are 50% higher than the odds with placebo; understanding this requires a knowledge of what the odds with placebo are as well as an understanding of what odds mean. Odds are not as easily understood as risks are. Odds are numerically different from risks, and the OR is numerically different from the RR. The difference between the OR and the RR is numerically small when the risks are similar in the two groups and also when the risks are dissimilar but the risk is small in the group of interest. The difference between the OR and the RR becomes increasingly large when the risks are dissimilar in the two groups and when the risk in the group of interest is not small. Smallness of risk, in this context, has been conservatively stated as 10%, but it could be possible to use a higher cutoff, such as 20%. Other issues related to risk, odds, RR, and OR are also discussed.
J Clin Psychiatry 2018;79(6):18f12641
To cite: Andrade C. Why odds ratios can be tricky statistics: the case of finasteride, dutasteride, and sexual dysfunction. J Clin Psychiatry. 2018;79(6):18f12641.
To share: https://doi.org/10.4088/JCP.18f12641
© Copyright 2018 Physicians Postgraduate Press, Inc.
The 5α-reductase inhibitor (5ARI) drugs finasteride and dutasteride are used to treat benign prostatic hyperplasia (BPH) and androgenetic alopecia (AGA). In a systematic review and meta-analysis of 17 randomized controlled trials (RCTs; pooled N = 17,494) of the sexual adverse effects (AEs) of these two 5ARIs, Liu et al1 found that the drugs were associated with a 69% increase in the risk of impaired libido and a 55% increase in the risk of erectile dysfunction in men with BPH; both findings were statistically significant. Importantly, the risks of these sexual AEs were not significantly impacted in men with AGA; a possible explanation is that lower doses of 5ARIs are used in AGA. There is therefore a need to better understand the sexual AEs of 5ARIs in men with BPH.
Sexual Adverse Effects of Finasteride and Dutasteride in Benign Prostatic Hyperplasia
Corona et al2 described a systematic review and meta-analysis of the sexual AEs of finasteride and dutasteride specifically in men with BPH. These authors searched electronic databases and other sources and identified 17 placebo-controlled RCTs of finasteride (5 mg/d) and dutasteride (0.5 mg/d) in BPH; in no trial did patients receive α receptor blockers or phosphodiesterase inhibitors, both of which are also used to treat BPH and both of which are also known to influence sexual functioning.
There were 12 finasteride RCTs, 4 dutasteride RCTs, and 1 RCT that examined both drugs. The RCTs included 24,463 men in the active arms and 22,270 men in the placebo arms. The mean age of the men in the RCTs was 64 years. The mean follow-up duration was 99 weeks; that is, nearly 2 years.
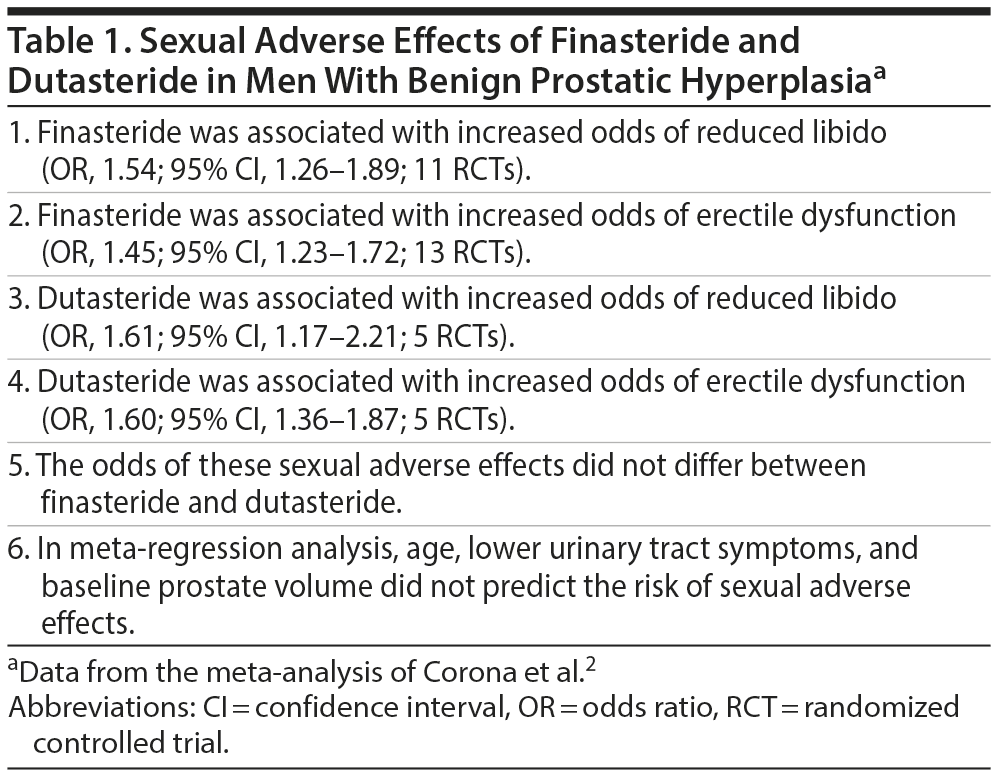
Important findings from the meta-analysis are presented in Table 1. In summary, finasteride (5 mg/d) and dutasteride (0.5 mg/d) were each associated with an increased likelihood that treated patients would suffer from reduction in libido or from erectile dysfunction; there was little difference between the two drugs, in these regards.
Unanswered Questions
The information provided in the meta-analysis2 is unsatisfying and incomplete. It tells us that finasteride and dutasteride are more likely than placebo to cause sexual AEs. However, we are not explained how much more likely this is in either absolute or relative terms.
First, consider the absolute increase in risk. Nowhere in the meta-analysis do the authors2 tell us what the absolute risks were in drug vs placebo groups. For example, was the risk of erectile dysfunction 4% in the placebo group and was it elevated to 6% with finasteride? Or was it 30% in the placebo group and was it elevated to 50% with finasteride? These numbers would have been available in the RCTs on which the meta-analysis was based, and these numbers would have provided us with an immediate understanding of the absolute magnitude of the problem when 5ARIs are prescribed to men with BPH. These numbers could also have been used to calculate numbers needed to harm statistics.3 Most important of all, these numbers could easily be communicated to patients, and patients would easily understand the risks involved with treatment.
Next, consider the relative increase in risk. Finasteride was, by way of example, associated with increased odds of erectile dysfunction; the odds ratio (OR) was 1.45 (Table 1). This means that the odds of erectile dysfunction with finasteride were 1.45 times the odds of erectile dysfunction with placebo. However, we don’ t know what the odds of erectile dysfunction with placebo were, and odds are anyway a little difficult to understand, as will be explained below. So, knowing that the OR was 1.45 just tells us that erectile dysfunction was more common with finasteride. It does not tell us how much more common in a way that we could understand and explain to patients.
Note that an OR of 1.45 does not mean that finasteride is associated with a risk that is 45% higher than that in the comparison (placebo) group. Such an interpretation would be correct had the statistic been the relative risk (RR) instead of the OR.4 Such an interpretation would also have been easy to explain to patients. Because odds and ORs are not easy to intuitively understand, the authors of the meta-analysis2 should have presented RRs instead of ORs. Relative risks are easy to compute from RCT data, and considering that the meta-analysis was conducted on RCTs, RRs and not ORs should have been extracted.
Curiously, authors of other meta-analyses of the sexual AEs of 5ARIs have also examined RCTs and presented ORs instead of RRs.5 Authors of meta-analyses in other contexts have also done likewise.6,7
Quick Answers
So what are the relative and absolute risks of sexual AEs with finasteride and dutasteride? The meta-analysis of Liu et al,1 referred to in the introduction to this article, indicated that these drugs are associated with a 69% increase in the risk of impaired libido (RR, 1.69; 95% CI, 1.03-2.79) and a 55% increase in the risk of erectile dysfunction (RR, 1.55; 95% CI, 1.14-2.12) in men with BPH. However, this meta-analysis also did not present the absolute risks.
What the absolute risks for each drug are depend on the RCT, the year of follow-up after treatment initiation, the method of ascertainment of the sexual adverse effects, and other matters. Most of the data suggest that the absolute risks for drug vs placebo are single-digit numbers, with a few studies suggesting absolute risks that are in the 10%-20% range. To be more precise than this would require a meta-analysis, which is what Liu et al1 and Corona et al2 presented without providing the information of interest.
Risk and Odds: What They Are
The risk of an event is the probability of occurrence of that event. It is calculated as the number of favorable events divided by the total number of possible events. Or, it may be stated as the number of times something happened divided by the number of times it could have happened. For example, the risk of a tossed coin falling heads is 1/2 or 0.5. This is because the number of favorable events (heads) is 1 and because the total number of possible events (heads and tails) is 2. Similarly, the risk that a rolled die will display the number 4 is 1/6 because there is only one 4 on a die and there are 6 numbers that the die may display.
The odds of an event is the ratio of the number of favorable events to the number of unfavorable events. Or, it may be stated as the ratio of the number of times something happened to the number of times it did not happen. Thus, the odds of a tossed coin falling heads is 1:1 because there is 1 favorable event (heads) and 1 unfavorable event (tails). Or, the odds that a rolled die will display the number 4 is 1:5 or 1/5 because there is one favorable event (the number 4) and 5 unfavorable events (the numbers 1, 2, 3, 5, and 6).
Risk and Odds: When They Are Similar and When They Are Not
Now here is something important. When an event is rare, the risk and the odds of that event are similar. However, when an event is common, the risk and the odds of that event can be widely dissimilar, as evident from the examples below.
Consider an AE that occurs in 1% of patients. The risk of that AE is 1 in 100 or 1/100 or 0.01. The odds of that AE are 1:99, which is like saying 1/99 or 0.01. The difference between the two is seen only at the fourth decimal place.
However, consider an AE that occurs in 50% of patients. The risk of that AE is 50 in 100 or 50/100 or 0.5. The odds of that AE are 50:50, which is like saying 50/50 or 1.0. There is a very big difference between 0.5 and 1.0.
And consider an AE that occurs in 90% of patients. The risk of the event is 90/100 or 0.9 whereas the odds are 90:10 or 9.0. There is a huge difference between 0.9 and 9.0. So the more common an event is, the larger the difference between the risk and the odds of that event.
A Brief Diversion
Why would anybody want to use the odds given that the concept is not easy to understand? Well, everybody would easily understand that an event with 90% risk will happen 9 times out of 10. However, it would take a gambler to understand that an odds of 9 (which is the same as a 90% risk; see above) means that the chances of a horse winning are 9 to 1; that is, the horse is 9 times as likely to win as it is to lose. Because we would like to think that neither our colleagues nor our patients gamble, perhaps we should prefer to compute the risk instead of the odds.8
Notice that if we want to know the risk of an event not occurring, we must subtract the risk of the event from 1 (or from 100%). Thus, a 0.9 (or 90%) risk that an event will happen translates to a 0.1 (or 10%) risk that the event will not happen. In the case of the odds, we need to invert the number (ie, take its reciprocal). So a 9:1 odds that a horse will win translates to a 1:9 odds that the horse will lose.
Looking at the Relative Risk and the Odds Ratio
The RR compares the risk of an event in 2 groups, such as treatment vs placebo groups. Likewise, the OR compares the odds of an event in 2 groups.4 Note that the event can be unfavorable, such as an AE, or favorable, such as response to or remission with a drug.
Now here is a critical question. As already discussed, the risk and odds are similar when an event is rare and increasingly dissimilar as the event becomes increasingly frequent. So will this “distortion” in the odds, related to the frequency of the event, cancel out in a ratio? That is, when computing the OR, if the numerator odds for a frequent event are pulled away from the value of the risk and if the denominator odds of that frequent event are also pulled away from the value of the risk, then, perhaps, the ratio of these values (that is, the OR) might be similar to the RR.
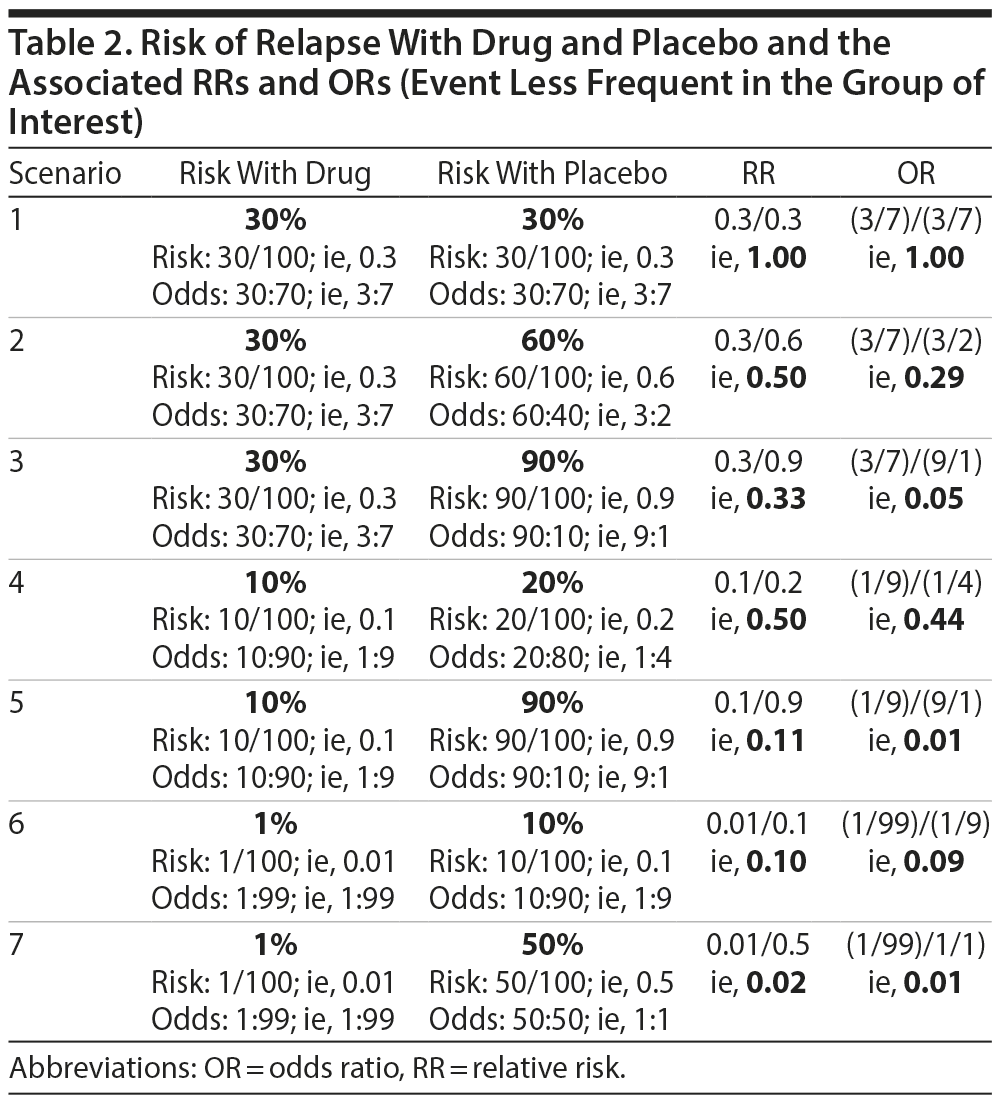
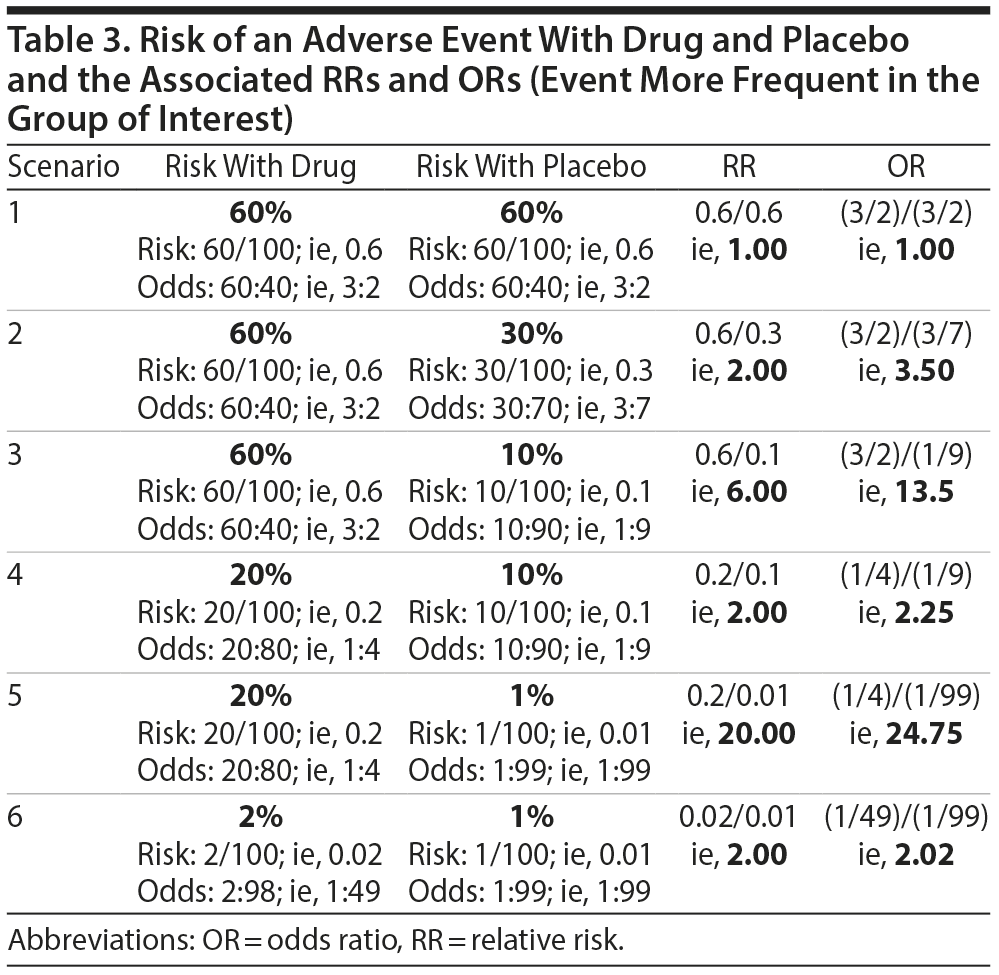
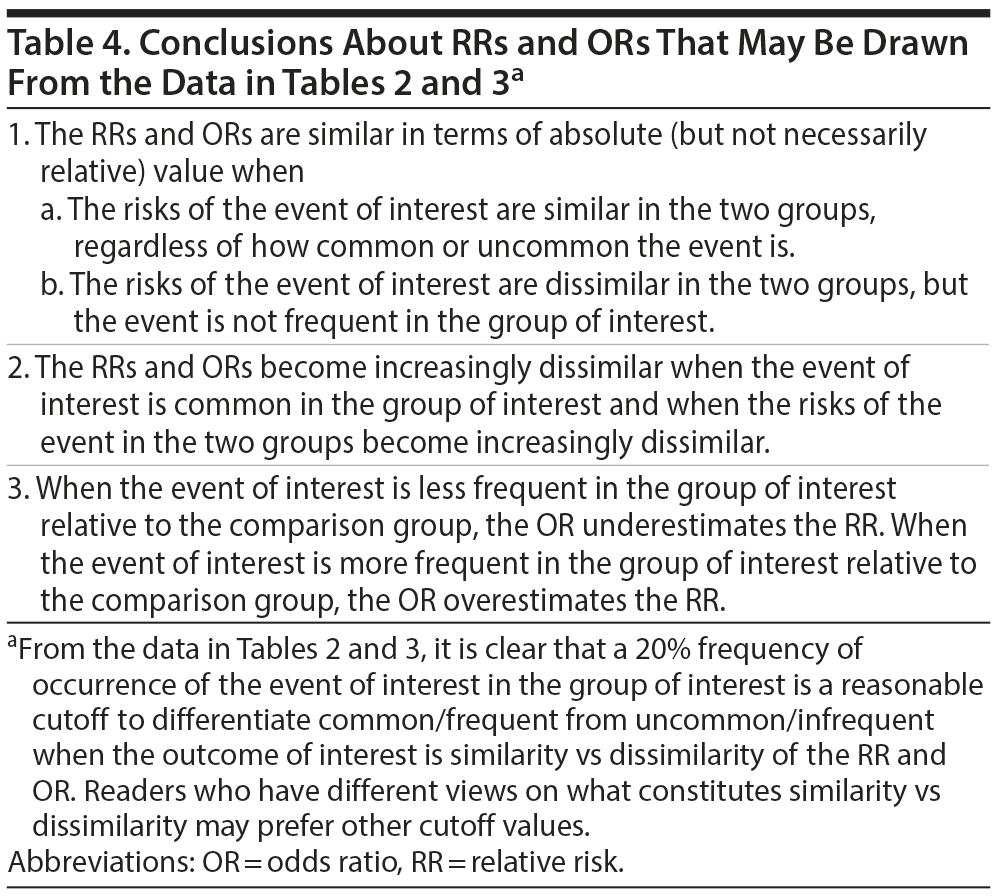
Let us examine this possibility using specific examples. Table 2 presents different scenarios with computations for risk, odds, RR, and OR for relapse after treatment of a disorder with drug or with placebo. In this table, the event of interest (relapse) is less frequent in the group of interest (drug) relative to the comparison (placebo) group. Table 3 is similar but presents scenarios in which the event of interest is more frequent in the group of interest relative to the comparison group. An examination of the data in Tables 2 and 3 suggests conclusions that are stated in Table 4.
From Tables 2, 3, and 4, it is clear that it is insufficient to state that ORs approximate RRs when the event is rare, a note that is common in explanatory articles and texts on these statistics.8-10 In this context, what might be considered as rare vs common is suggested in the clarificatory note in Table 4. The bottom line is that if the event of interest occurs with a frequency of 20% or less in the group of interest, then it would not be grievously wrong to interpret the OR as though it were an RR. However, if the event in the group of interest is more common, the OR will overestimate or underestimate the RR appreciably. More conservative authors have suggested a lower value, 10%, as the cutoff.8,9
Another Brief Diversion
In a placebo-controlled RCT, the group of interest is “drug,” and so we compare risks between drug and placebo groups; the risk with drug is the numerator and the risk with placebo is the denominator when computing the RR. What happens when 2 active treatments are compared? In that case, either treatment could be considered as the group of interest and placed in the numerator position to calculate the RR. The reciprocal of this RR yields the RR for the other group as the group of interest.
As an example, if the risk of an event is 10% with drug and 90% with placebo, then the RR for drug as compared with placebo is 10/90 or 0.11 (Table 2, scenario 5). If we want to know the RR for placebo as compared with drug, the calculation becomes 90/10 or 9.00. These mean that the relapse rate with drug is only 11% of the relapse rate with placebo, and that the relapse rate with placebo is 9 times the relapse rate with drug. Note that the reciprocal of 0.11 is 9.00, and that the reciprocal of 9.00 is 0.11.
In the same manner, the reciprocal of the OR gives the OR for the comparison group, taken as the group of interest.
Statistics textbooks8 describe mathematical procedures for converting ORs to RRs, but journal readers should not be expected to apply these formulae to make sense of ORs that are extracted from RCTs.
Concluding Notes
Finasteride (5 mg) and dutasteride (0.5 mg) comparably increase the risk of impaired libido and impaired erectile function in elderly men with BPH. Odds and ORs can be tricky to understand; risk and RRs should be presented wherever possible, such as in RCTs or when data from RCTs are summarized in meta-analyses.
Published online: November 27, 2018.
 Each month in his online column, Dr Andrade considers theoretical and practical ideas in clinical psychopharmacology with a view to update the knowledge and skills of medical practitioners who treat patients with psychiatric conditions.
Department of Clinical Psychopharmacology and Neurotoxicology, National Institute of Mental Health and Neurosciences, Bangalore, India ([email protected]).
Financial disclosure and more about Dr Andrade.
References
1. Liu L, Zhao S, Li F, et al. Effect of 5α-reductase inhibitors on sexual function: a meta-analysis and systematic review of randomized controlled trials. J Sex Med. 2016;13(9):1297-1310. PubMed CrossRef
2. Corona G, Tirabassi G, Santi D, et al. Sexual dysfunction in subjects treated with inhibitors of 5α-reductase for benign prostatic hyperplasia: a comprehensive review and meta-analysis. Andrology. 2017;5(4):671-678. PubMed CrossRef
3. Andrade C. The numbers needed to treat and harm (NNT, NNH) statistics: what they tell us and what they do not. J Clin Psychiatry. 2015;76(3):e330-e333. PubMed CrossRef
4. Andrade C. Understanding relative risk, odds ratio, and related terms: as simple as it can get. J Clin Psychiatry. 2015;76(7):e857-e861. PubMed CrossRef
5. Favilla V, Russo GI, Privitera S, et al. Impact of combination therapy 5-alpha reductase inhibitors (5-ARI) plus alpha-blockers (AB) on erectile dysfunction and decrease of libido in patients with LUTS/BPH: a systematic review with meta-analysis. Aging Male. 2016;19(3):175-181. PubMed CrossRef
6. Pae CU, Wang SM, Han C, et al. Vortioxetine, a multimodal antidepressant for generalized anxiety disorder: a systematic review and meta-analysis. J Psychiatr Res. 2015;64:88-98. PubMed CrossRef
7. Jun JEJ, Kinkade A, Tung ACH, et al. 5α-reductase inhibitors for treatment of benign prostatic hyperplasia: a systematic review and meta-analysis. Can J Hosp Pharm. 2017;70(2):113-119. PubMed
8. Norman GR, Streiner DL. Biostatistics: The Bare Essentials. 4th ed. Shelton, CT: People’s Medical Publishing House; 2014.
9. Viera AJ. Odds ratios and risk ratios: what’s the difference and why does it matter? South Med J. 2008;101(7):730-734. PubMed CrossRef
10. Ranganathan P, Aggarwal R, Pramesh CS. Common pitfalls in statistical analysis: odds versus risk. Perspect Clin Res. 2015;6(4):222-224. PubMed CrossRef
This PDF is free for all visitors!
