ABSTRACT
Statistics such as the mean difference (MD), standardized mean difference (SMD), relative risk (RR), odds ratio (OR), hazard ratio (HR), and others are meant to be examined along with their 95% confidence intervals (CIs), and their significance can be understood by viewing these CIs as compatibility intervals. The 95% CIs around the MD and SMD are easily understood because they are expressed along a linear scale. The 95% CIs around the RR, OR, and HR are harder to understand because they are expressed along an exponential scale; however, when the numbers are log-transformed, they are linearized, and understanding becomes easy. Another approach to understanding the CIs around the RR, OR, or HR is to examine the reciprocal of the lower limit of the CI; however, because the reciprocal also lies along an exponential scale, this method is inferior to the log-transformation method. These approaches may seem daunting, but the difficulty is an illusion because log transformation or reciprocal transformation takes only a few seconds when a statistical calculator is opened. All terms and concepts are explained with extreme simplification and with the help of examples.

Findings from a sample are applicable only to the sample; research seeks to estimate what the population value may be. This is where the 95% confidence interval (CI) comes in. The 95% CI, which also conveys other useful information, was explained in detail in an earlier article in this column.1
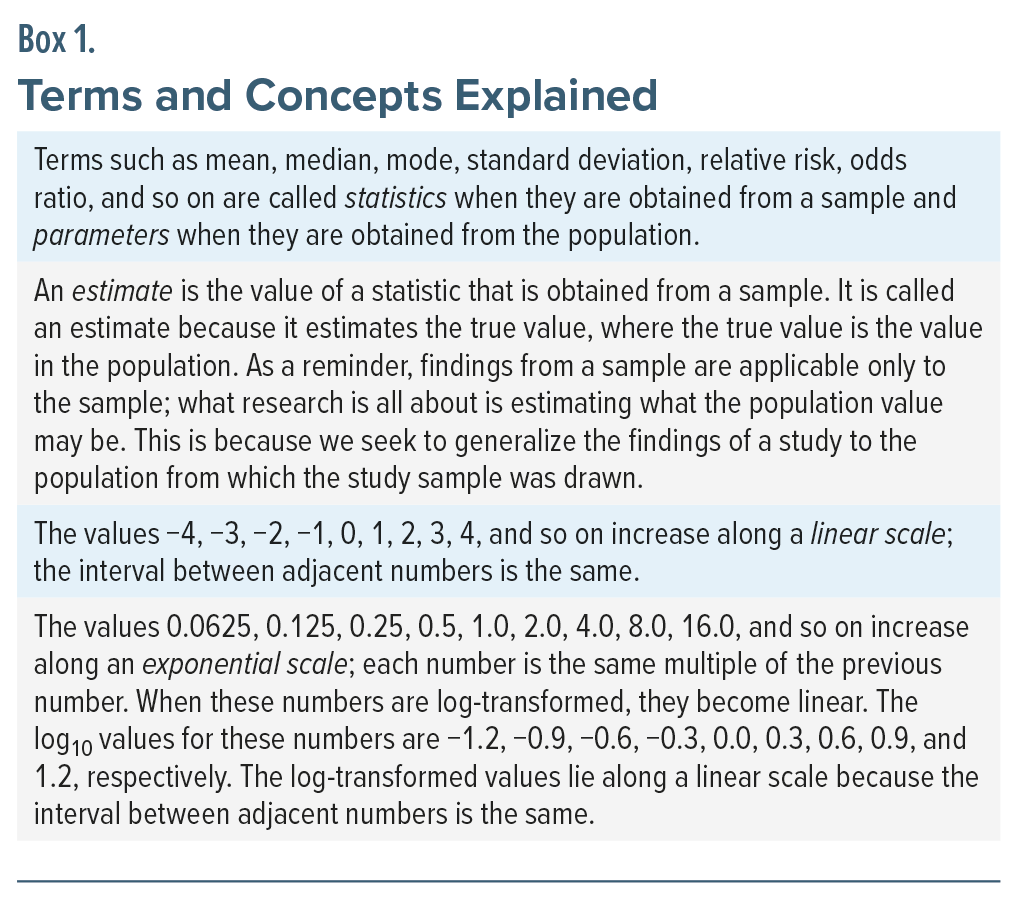
The 95% CIs around a mean, mean difference, standardized mean difference (SMD), and other statistics (Box 1) that are expressed along a linear scale (Box 1) are easy to understand. This is because, for these statistics, the lower and upper limits of the CI are equidistant from the estimate (Box 1). The 95% CIs around a relative risk (RR), odds ratio (OR), hazard ratio (HR), and other statistics are less easy to understand. This is because these statistics are expressed along an exponential scale (Box 1) and because, in consequence, the lower and upper limits of the CI are not equidistant from the estimate.
This article is intended to help readers interpret the 95% CI around statistics that are expressed along an exponential scale. Why this is important is explained in the context of a recent study of extended interval rituximab dosing in multiple sclerosis (MS).
Although there is much statistical and mathematical content in this article, readers are assured that the contents of this article are well within the grasp of the average cerebrum, and any reader who has chosen to read this article will certainly have a cerebrum that is well above average. This article is long only because detailed explanations are provided.
Rituximab for Multiple Sclerosis
Although rituximab is not an approved treatment for this indication, much literature has accumulated to support its off-label use in patients with multiple sclerosis (MS), especially relapsing-remitting multiple sclerosis (RRMS).2,3 Rituximab, in fact, is a popular and even first-line disease-modifying treatment for MS in several European countries.4 In this context, Starvaggi Cucuzza et al5 described a cohort study of RRMS patients who had been treated with rituximab.
The Study by Starvaggi Cucuzza et al5
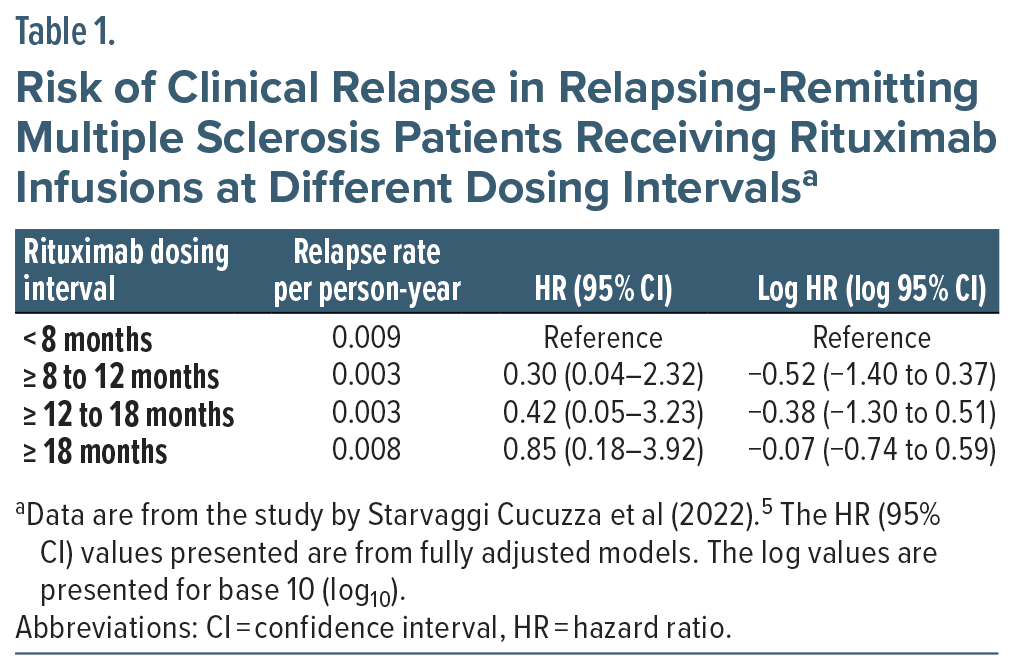
These authors examined 718 RRMS patients (71% female) who had each received at least 2 (median, 6) rituximab infusions at different dosing intervals across a median follow-up of 4.2 years. In these patients, Cox proportional hazards regression was used to examine relapse rates at < 8, ≥ 8 to 12, ≥ 12 to 18, and ≥ 18 months intervals since the last infusion (Table 1).
In these analyses, the < 8 months interval was set as the reference interval and the risk of relapse in the other, extended intervals was compared with the risk of relapse in the reference interval. The analyses were adjusted for various covariates, including age, sex, disability score, number of previous rituximab infusions, number of clinical relapses in the year before commencement of rituximab treatment, number of T2 lesions in brain MRI scans before commencement of rituximab treatment, and prior exposure to disease-modifying treatments.
There were 24 clinical relapses during follow-up. Twenty of these occurred at < 8 months, and the remaining 4, during the extended dosing intervals. The incidence rates for relapse, expressed per person-year of follow-up, were actually lower, not higher, during the extended dosing intervals relative to the reference interval (Table 1, column 2); the implication is that prolonging the interval between infusions did not increase the risk of relapse. Nevertheless, it is important to examine risk after adjusting for covariates because crude values can change substantially after adjustments.6 The results of the fully adjusted Cox regression analyses are presented in Table 1, column 3.
Digression: The Hazard Ratio and Its 95% Confidence Interval
The HR is the statistic for risk that is estimated in Cox regression.7–9 It is a ratio because the risk in the group of interest is compared with the risk in the reference group. The former risk is the numerator value in the ratio and the latter risk is the denominator value.
Technically, the risk in such a context is more correctly known as a hazard. A hazard is different from risk in that it implies a time-to-event analysis. That is, it implies that we’re interested in finding out not just whether an event (such as relapse) occurred but how early or late it occurred. This is because the event rates may be the same in both groups (eg, everybody eventually relapsed) but events occurred earlier in one group than in the other. For the sake of easier discussion, in the rest of the article the term risk will continue to be used as a non-technical substitute for hazard. This is appropriate because what is explained in this article in the context of the HR is also applicable to the RR and the OR.
An HR that is exactly 1.00 means that the risk is exactly the same in the group of interest and in the reference group; when a value is divided by an identical value, the result is 1.00. So, for the HR, 1.00 represents the value of “no difference.” An HR that is < 1.00 indicates that the risk is lower in the group of interest than in the reference group. An HR that is > 1.00 indicates that the risk is higher in the group of interest than in the reference group.
HRs that are estimated in a study are presented along with 95% CIs. If the entire CI around the HR is below 1.00, it means that the HR estimated in the study indicates a lower risk of the event and that the HR is statistically significant (P < .05). If the entire 95% CI around the HR is above 1.00, it means that the HR estimated in the study indicates a higher risk of the event and that the HR is statistically significant (P < .05).
If the 95% CI around the HR surrounds the value of “no difference,” that is, 1.00, the HR estimated in the study is not statistically significant (P > .05) because the CI indicates that the population value for the HR can be either < 1.00, indicating lower risk, or > 1.00, indicating higher risk.
In these regards, the interpretation of the HR is exactly the same as the interpretation of the RR or OR. Explanations about RR, OR, and 95% CI were presented in earlier articles in this column.1,10
Interpreting the Findings of the Study5
Column 3 in Table 1 presents the HRs and the 95% CIs for each extended dosing interval relative to the reference interval. It is immediately apparent that each CI includes 1.00; that is, the lower limit of each CI is below 1.00 and the upper limit, above 1.00. This means that the HRs in Column 3 are “not statistically significant.” That is, the risk of relapse in each of the 3 extended dosing intervals is not significantly different from the risk of relapse in the reference dosing interval.
This is the point at which most people would stop, and they would not be (very) wrong to do so. However, consider: what is the point in presenting a CI if full use is not made of it? This is where use of the CI as a compatibility interval comes into the picture.
Digression: Compatibility Intervals
Statisticians wince when investigators and readers draw conclusions based on P values. Here is an example that explains why they are pained. In a hypothetical study, patients treated with melatonin fell asleep a mean of 15 (95% CI, −1 to 31) min quicker than patients treated with placebo (P > .05). A superficial conclusion is that melatonin was no better than placebo in hastening sleep onset because the P value did not meet the threshold for statistical significance. Why would a statistician wriggle at this conclusion? Explanations follow.
For the mean difference statistic, we subtract the dependent variable value for placebo from the dependent variable value for melatonin. If our answer is 15 min for improvement in sleep latency, it means that, with regard to improving sleep latency, melatonin was better than placebo by 15 min. If we get 0, it means that melatonin was no different from placebo with regard to improving sleep latency. If we get a negative value, it means that melatonin was worse than placebo in improving sleep latency.
As a digression within a digression, for statistics such as mean difference and SMD, if the entire CI lies above 0, we conclude that the finding is statistically significant in one direction, and if the entire CI lies below 0, the finding is statistically significant in the other direction. So, here, the value that indicates “no difference” is 0. In the case of the HR, as explained earlier, the value for “no difference” is 1.
Now, the 95% CI in the hypothetical study was −1 to +31. This means that the population value for melatonin vs placebo is likely to lie anywhere between −1 and 31 min. That is, melatonin can produce slightly worse results than placebo (by up to 1 min), be no different from placebo (be 0), or be very much better than placebo (by up to 31 min).
This is where the concept of compatibility intervals comes in. In this hypothetical melatonin study, the bulk of the CI lies above 0, implying that the population value is very likely to be above 0, thereby suggesting that melatonin is very likely to be superior to placebo in improving sleep latency. A statistician, therefore, would conclude that the study did not find melatonin to be “significantly” superior to placebo, but the 95% CI was compatible with the likelihood of an advantage for melatonin.
In other words, when 95% CIs are regarded as compatibility intervals, based on where the upper and lower limits of the CIs lie with regard to the value that indicates “no difference,” we form impressions about what the findings might mean. A further discussion on compatibility intervals is available elsewhere.11,12
There are no difficulties in interpreting 95% CIs as compatibility intervals when the numbers lie along a linear scale. This is because the estimate lies in the center of the CI. That is, the distance between the estimate and the lower limit of the CI is the same as the distance between the estimate and the upper limit. So, in the hypothetical melatonin study described above, it is obvious that 0 to 31 is far greater than −1 to 0, suggesting that the population value is much more likely to lie between 0 and 31 (with the estimate at 15) than between −1 and 0. However, when statistics lie along an exponential scale, difficulties arise.
Statistics That Lie on an Exponential Scale
Statistics such as the RR, the OR, and the HR, along with their 95% CIs, lie along an exponential scale. Consider the RR, which is a statistic that compares the risk of an outcome between 2 groups. We might say that sertraline is twice as likely to cause nausea as placebo; that is, the RR is 2. Or, we might express the same finding by saying, instead, that placebo is half as likely to cause nausea as sertraline; that is, the RR is 0.5. As explained earlier in the context of the HR, if the risk of nausea is identical for sertraline and placebo, the RR would be 1. We can therefore intuitively understand that, for RR, 0.5 and 2.0 are equidistant from 1. This is possible only when the data are plotted on an exponential scale. We need to use log transformation to make exponential values linear.
The log10 values for 0.5, 1.0, and 2.0 are −0.30, 0, and 0.30, respectively. This makes it obvious that 0.5 and 2.0 are equidistant from 1.0 on a log10 scale. The natural logarithm (ln) values for 0.5, 1.0, and 2.0 are −0.69, 0, and 0.69, respectively; again, 0.5 and 2.0 are seen to be equidistant from 1.0. So, it does not make a difference whether we use logarithms to base 10 or logarithms to base e.
From this discussion, it follows that, when presenting the RR, OR, or HR along with their 95% CIs, the data are expressed in everyday numbers because our brains understand everyday numbers and not their logarithms; however, in such situations, when interpreting the 95% CIs as compatibility intervals, we need to see their log values so that we can judge where the CIs lie with reference to the log of 1.0, which is the value that indicates “no difference.”
Returning to the Study5
The logs of the HR (95% CI) values in Table 1 are presented in the last column. In that column, a little mental arithmetic tells us that the lower limit and upper limit of the log CI each differ from the corresponding log HR by approximately 0.88 for the ≥ 8 to 12 months dosing interval, by 0.92 for the ≥ 12 to 18 months dosing interval, and by 0.67 for the ≥ 18 months dosing interval (small differences in pairs of values could be because of downstream effects of rounding off). In other words, the HRs and the 95% CIs now look like what we see for statistics such as the mean, mean difference, SMD, and other statistics that, along with their 95% CI, are linear. And, for this reason, although the values in the last column of the table are log values, they can be understood as though they are linear.
Whereas the log values in Table 1 are presented for base 10 (log10), the conclusions would be the same had natural log values (ln) been presented, instead.
Now, if we remember that “no difference” for the HR is a value of 1 and that the log of 1 is 0, it becomes easy to examine the log CIs as compatibility intervals. For the ≥ 18 months interval, it is straightaway obvious that the CI is reasonably equally distributed on either side of 0; the limits of the CI are 0.74 away from 0 in 1 direction and 0.59 away from 0 in the other direction. For each of the ≥ 8 to 12 months and ≥ 12 to 18 months intervals, however, far more of the CI lies below 0 than above 0 (by 1.40 vs 0.37 and by 1.30 vs 0.51, respectively). Nevertheless, viewing these log CIs as compatibility intervals, it is obvious that for none of them would we confidently assert that the log CIs are compatible with a lower risk of relapse.
So, it appears that we have reached this point only to conclude what we could have concluded merely by looking at the P value. Before addressing this uncomfortable thought, we need to consider what follows in later sections.
Summarizing the Log Method
What has been explained so far actually requires very little effort. All that a reader needs to do is to open a scientific calculator either online or from the device system resources, enter the HR, and click on log (or ln). This step is repeated for the upper limit and for the lower limit of the CI. The process takes less than a minute. Examination of the log HR and interpretation of the log 95% CI as a compatibility interval takes only a few additional seconds.
The interested reader can try this exercise using the data from Table 1, column 3 and the log10 function. The results should match what is presented in Table 1, column 4.
The Reciprocal Method
Is there another way to interpret the CIs? Indeed there is. Whether this method, the reciprocal method, is easier is a matter of opinion. Whether it is easy to understand is easily answered: it is. Whether it is better than the log method is also easily answered: it is not.
Consider: as already explained, HR, RR, and OR values of 0.5 and 2.0 are equidistant from 1.0, the value of “no difference” in risk. This is because one is half the risk and the other is double the risk. Similarly, if the risk in Group A is one-third the risk in Group B, the risk in Group B must be thrice that in Group A. That is, risks of 0.33 and 3.00 are equidistant from 1.00.
A moment’s reflection suffices to understand that values such as 0.5 and 2.0, or 0.33 and 3.00 are reciprocals. So, if the risk is increased by 50% in 1 group, the ratio of interest is 150/100 or 3/2. The equivalent risk in the other group should therefore be its reciprocal, 2/3, which translates to 67%. That is, if the RR for Group A relative to Group B is 1.5, the RR for Group B relative to Group A is 0.67, indicating a 33% decreased risk (Box 2).
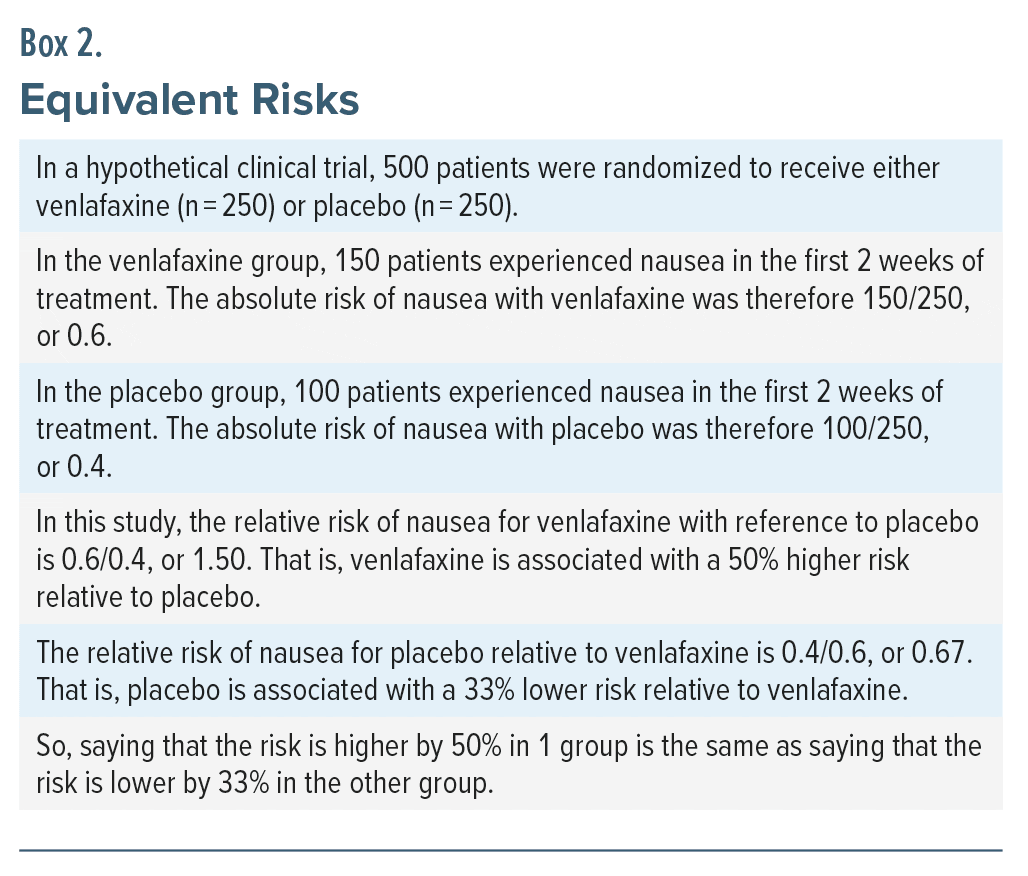
Summing up, saying that a 50% increased risk is equal in magnitude to a 33% reduced risk is definitely not intuitive. This is one reason why using the reciprocal method (see the next section) is not as good as inspecting results using log values.
Digressing, 3/2 or 1.5 yields a log10 value of 0.18, and 2/3 or 0.67 yields a log10 value of −0.18. This shows that the reciprocal method is consistent with the log method.
Digressing again, an RR of 1.30 means that the risk is increased by 30%, and an RR of 0.70 means that the risk is reduced by 30%. From the discussion in this section, we can understand why these values for increase and the decrease are not equal in magnitude.
Returning to the Study5
Here is how the reciprocal method can be applied to the values in Table 1. Let us take only the lower limit of the CI. For the ≥ 8 to 12 months interval, the lower limit is 0.04; that is, 1/25. The reciprocal of this number is 25. So, for the CI to be perfectly balanced around 1.00, the value of “no difference,” the upper limit of the CI should be 25.00. However, the upper limit is actually 2.32, not 25.00. This creates an impression that the CI for this dosing interval (0.04–2.32) is hugely shifted to the left and that the bulk of the CI is hugely below 1.00. The implication is that the CI is compatible with the conclusion that the ≥ 8 to 12 months dosing interval with rituximab is associated with a decreased risk of relapse.
The impression of hugeness, referred to above, arises because 2 and 25 are very far apart. So, if the upper limit of the CI has been shifted to the left by such a large quantity, the CI below 1.00 must also be a large quantity. This hugeness is an illusion that is created by the exponential scale that expands as we move to the right (Box 1). This is the other reason why using the reciprocal method is not as good as using the log method when examining the CI as a compatibility interval.
Other Notes
The exponential nature of the 95% CI values of the RR, OR, and HR explains why the estimate lies closer to the lower limit of its CI than to its upper limit. This can be seen in Table 1, column 3.
The exponential nature of the values of the RR, OR, and HR is the reason why, in forest plots, these statistics are plotted on the x-axis in intervals that have been log-transformed.13
Take-Home Message
The results of studies should not be interpreted based on P values. Rather, they should be interpreted based on the 95% CIs around the statistics of interest, where these CIs are interpreted as compatibility intervals. The 95% CIs around statistics such as the mean difference and SMD can be interpreted as they stand because they lie along a linear scale. The 95% CIs around statistics such as the RR, OR, and HR cannot be interpreted as they stand because they lie along an exponential scale; so, they need to be log-transformed before they can be interpreted as compatibility intervals. For the RR, OR, and HR, examining the reciprocal of the lower limit of the CI can improve the understanding of the CI, but, because the exponential nature of the value is preserved, this method may distort an understanding of the CI as a compatibility interval; so, log transformation remains the preferred method. Log transformation can be performed to base 10 or to base e, and the entire procedure for transformation of an estimate and its CI, and the interpretation thereof, takes less than a minute.
Parting Notes
Readers who have reached this point will easily understand why, appearances notwithstanding, we do not have good reason to conclude that extended dosing intervals with rituximab is associated with fewer relapses in patients with RRMS. Besides the statistical explanations provided in this article, the reader must also consider the strong likelihood of confounding by indication: patients who were judged by clinicians to carry a good prognosis may have been more likely to receive extended dosing schedules, and this bias may not have been adequately adjusted for in the Cox regressions.
Article Information
Published Online: May 31, 2023. https://doi.org/10.4088/JCP.23f14933
© 2023 Physicians Postgraduate Press, Inc.
To Cite: Andrade C. How to understand the 95% confidence interval around the relative risk, odds ratio, and hazard ratio: as simple as it gets. J Clin Psychiatry. 2023;84(3):23f14933.
Author Affiliations: Department of Clinical Psychopharmacology and Neurotoxicology, National Institute of Mental Health and Neurosciences, Bangalore, India ([email protected]).
Acknowledgments: This manuscript benefited from helpful discussions with David L. Streiner, PhD, FCAHS, CPsych (Ret), Emeritus Professor, Department of Psychiatry & Behavioural Neurosciences, McMaster University, and Professor, Department of Psychiatry, University of Toronto, Canada, and K. Thennarasu, PhD, Professor, Department of Biostatistics, National Institute of Mental Health and Neurosciences, Bangalore, India.
 Each month in his online column, Dr Andrade considers theoretical and practical ideas in clinical psychopharmacology with a view to update the knowledge and skills of medical practitioners who treat patients with psychiatric conditions.
References (13)

- Andrade C. A primer on confidence intervals in psychopharmacology. J Clin Psychiatry. 2015;76(2):e228–e231. PubMed CrossRef
- Filippini G, Kruja J, Del Giovane C. Rituximab for people with multiple sclerosis. Cochrane Database Syst Rev. 2021;11(11):CD013874. PubMed
- de Sèze J, Maillart E, Gueguen A, et al. Anti-CD20 therapies in multiple sclerosis: from pathology to the clinic. Front Immunol. 2023;14:1004795. PubMed CrossRef
- Torgauten HM, Myhr KM, Wergeland S, et al. Safety and efficacy of rituximab as first- and second line treatment in multiple sclerosis: a cohort study. Mult Scler J Exp Transl Clin. 2021;7(1):2055217320973049. PubMed CrossRef
- Starvaggi Cucuzza C, Longinetti E, Ruffin N, et al. Sustained low relapse rate with highly variable B-cell repopulation dynamics with extended rituximab dosing intervals in multiple sclerosis. Neurol Neuroimmunol Neuroinflamm. 2022;10(1):e200056. PubMed CrossRef
- Andrade C. Odd odds. J Clin Psychiatry. 2011;72(11):1558–1559, author reply 1559. PubMed CrossRef
- Streiner DL. Stayin’ alive: an introduction to survival analysis. Can J Psychiatry. 1995;40(8):439–444. PubMed CrossRef
- Schober P, Vetter TR. Survival analysis and interpretation of time-to-event data: the tortoise and the hare. Anesth Analg. 2018;127(3):792–798. PubMed CrossRef
- Andrade C. Survival analysis, Kaplan-Meier curves, and Cox regression: basic concepts. Indian J Psychol Med. 2023;45(4). Forthcoming.
- Andrade C. Understanding relative risk, odds ratio, and related terms: as simple as it can get. J Clin Psychiatry. 2015;76(7):e857–e861. PubMed CrossRef
- Amrhein V, Greenland S, McShane B. Scientists rise up against statistical significance. Nature. 2019;567(7748):305–307. PubMed CrossRef
- Andrade C. The P value and statistical significance: misunderstandings, explanations, challenges, and alternatives. Indian J Psychol Med. 2019;41(3):210–215. PubMed CrossRef
- Kim J, Kaufman JS, Bang H. Graphing ratio measures on forest plot. J Am Coll Cardiol. 2018;71(5):585–586. PubMed CrossRef
This PDF is free for all visitors!