Glucometabolic Hormones and Cardiovascular Risk Markers
in Antipsychotic-Treated Patients
ABSTRACT
Objective: Treatment with antipsychotic drugs is widely associated with metabolic side effects such as weight gain and disturbed glucose metabolism, but the pathophysiologic mechanisms are unclear.
Method: Fifty nondiabetic (fasting plasma glucose ≤ 7.0 mmol/L), antipsychotic-treated male patients (ICD-10 diagnosis code F20, F21, F22, F25, F28, or F60; mean ± SD age = 33.0 ± 6.7 years; body mass index [BMI; kg/m2] = 26.0 ± 4.7; waist circumference = 95.9 ± 13.3 cm; glycated hemoglobin A1c [HbA1c] = 5.7% ± 0.3%) and 93 age- and waist circumference–matched healthy male controls (age = 33 ± 7.3 years; BMI = 26.1 ± 3.9; waist circumference = 94.6 ± 11.9 cm; HbA1c = 5.7% ± 0.3%) participated in this cross-sectional study. Blood was sampled in the fasting state and 90 minutes after ingestion of a standardized liquid meal (2,268 kJ). The primary outcomes were glucometabolic hormones and cardiovascular risk markers. Data were collected between March 2008 and February 2010.
Results: Compared to healthy controls, patients were characterized by elevated fasting levels of proinsulin, C-peptide, and glucose-dependent insulinotropic polypeptide (GIP) (P < .05) and higher postprandial levels of insulin, proinsulin, C-peptide, and GIP (P ≤ .02). Also, patients exhibited elevated plasma levels of C-reactive protein and signs of dyslipidemia. Fasting plasma levels of insulin, glucagon, glucagon-like peptide-1 (GLP-1), ghrelin, leptin, adiponectin, tumor necrosis factor-α, plasminogen activator inhibitor-1, and interleukin-6 and postprandial levels of glucagon, GLP-1, ghrelin, leptin, and adiponectin did not differ between groups.
Conclusions: Presenting with an insulin resistant–like pattern, including beta cell hypersecretion and elevated GIP levels, nondiabetic antipsychotic-treated patients display emerging signs of dysmetabolism and a compromised cardiovascular risk profile. The appetite-regulating hormones GLP-1 and ghrelin appear not to be influenced by antipsychotic treatment. Our findings provide new clinical insight into the pathophysiology associated with metabolic side effects of antipsychotic treatment and put emphasis on the importance of implementing metabolic screening into psychiatric practice.
Trial Registration: ClinicalTrials.gov identifier NCT00627757
J Clin Psychiatry 2014;75(9):e899–e905
© Copyright 2014 Physicians Postgraduate Press, Inc.
Submitted: October 3, 2013; accepted March 19, 2014 (doi:10.4088/JCP.13m08820).
Corresponding author: Filip K. Knop, MD, PhD, Diabetes Research Division, Department of Medicine, Gentofte Hospital, University of Copenhagen, Niels Andersens Vej 65, DK-2900 Hellerup, Denmark ([email protected]).
Antipsychotic medication constitutes the basic treatment of psychotic symptoms. Despite the indisputable positive effect on the overall clinical outcome,1 it has become increasingly recognized that antipsychotics are associated with metabolic side effects and weight gain.2–4 With the introduction of the second-generation antipsychotics, especially clozapine and olanzapine, this problem has become even more evident.5,6
Increased body weight is an important risk factor for development of central obesity, insulin resistance, type 2 diabetes, dyslipidemia, and hypertension, conditions that in turn dramatically increase the risk of cardiovascular disease.7,8 Therefore, the increased mortality and morbidity inherent in severe mental illness is complicated by the fact that the necessary antipsychotic treatment is associated with dysmetabolism that in turn further compromises quality of life and life expectancy.9–11
The pathophysiologic mechanisms whereby antipsychotic drugs induce weight gain and disturbed glucose metabolism are unclear. The pancreatic glucoregulatory hormones insulin and glucagon have long been known to be involved in glucose metabolism and the development of diabetes.12 More recently, it has been shown that the gut incretin hormones glucagon-like peptide-1 (GLP-1) and glucose-dependent insulinotropic polypeptide (GIP) (released after meal ingestion) and the orexigenic hormone ghrelin (released from endocrine cells of the stomach in the fasting state and suppressed after meal ingestion) may also play important roles.13–15 Furthermore, the hormones leptin and adiponectin from adipose tissue and cardiovascular disease markers, including tumor necrosis factor-α (TNF-α), interleukin-6 (IL-6), plasminogen activator inhibitor-1 (PAI-1), blood lipids, and C-reactive protein (CRP), appear to be involved in the development of metabolic disturbances.16,17
In the present study, we aimed to investigate fasting and postprandial plasma concentrations of insulin, glucagon, GIP, GLP-1, and ghrelin, as well as leptin, adiponectin, blood lipid profile, CRP, TNF-α, IL-6, and PAI-1 in a sample of nondiabetic antipsychotic-treated patients and matched healthy controls. The primary outcomes were glucometabolic hormones and cardiovascular risk markers.
METHOD
The study was conducted in accordance with the Declaration of Helsinki II, approved by the Committees on Biomedical Research Ethics for the Capital Region of Denmark (registration number: H-C-2007-0069), the Danish Data Protection Agency, and the Danish Medicines Agency (registration number: 2602–706); the study was registered at ClinicalTrials.gov (identifier: NCT00627757). The study was carried out according to Good Clinical Practice (GCP) and monitored by the GCP of Unit Copenhagen University Hospital. Prior to enrollment, all participants received written and verbal information about the study and gave written informed consent. Data were collected between March 2008 and February 2010.
Participants
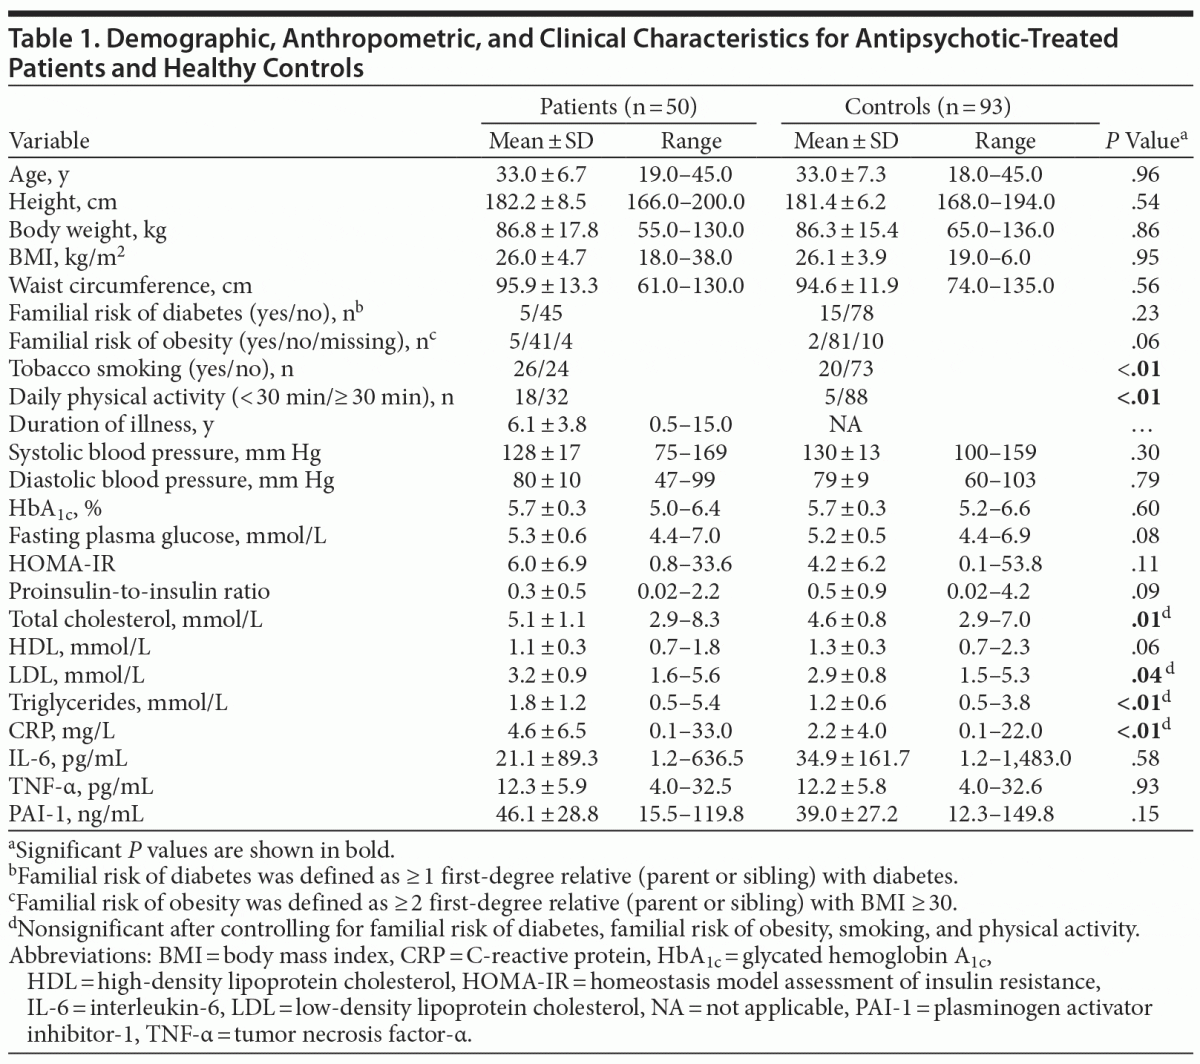
Fifty-one antipsychotic-treated male, nondiabetic (fasting plasma glucose ≤ 7.0 mmol/L) patients and 93 healthy male controls matched on age (± 5 years) and waist circumference (± 5 cm), were initially included. All patients were outpatients recruited from the Mental Health Services of the Capital Region of Denmark. We consecutively included patients to the study who were on continuous treatment with a minimum of 1 antipsychotic drug and with a clinical diagnosis in a coarsely defined schizophrenia spectrum (ICD-10 diagnosis: F20, F21, F22, F25, F28, or F60.1). Other inclusion criteria were male gender, white race, and age between 18–45 years. Exclusion criteria were inability to read, write, or speak Danish; a diagnosis of diabetes and/or other severe somatic comorbidity; treatment with cholesterol-lowering, antidiabetic, or antihypertensive medications; ongoing substance abuse; and duration of psychiatric illness > 15 years. For ethical reasons, forensic patients and patients under coercion were not included. Healthy controls were all white subjects recruited from the database at the Research Centre for Prevention and Health, Copenhagen University Hospital, Glostrup, Denmark, and by advertising in newspapers. Healthy controls were excluded in the presence of severe ongoing medical condition or inability to read, write, or speak Danish. Information on familial risk factors, tobacco smoking, daily physical activity, and duration of illness was obtained from interviews and clinical records when available. Characteristics of participants are shown in Table 1.
Experimental Procedures
At the day of investigation, participants arrived in the morning in a fasting state. Also, they were alcohol- and tobacco-free for at least 8 hours. After we collected blood samples for fasting measures, each subject ingested a 360-mL liquid meal (carbohydrates, 66.2 g; proteins, 21.6 g; and fat, 20.9 g [2,268 kJ]; Nutridrink, Nutricia A/S, Allerød, Denmark) over 10 minutes. After 90 minutes, blood was sampled again for postprandial measures. All blood samples (except for glycated hemoglobin A1c (HbA1c), which was frozen as heparinized whole blood) were centrifuged for 10 minutes at 3,000g at room temperature or at 4°C for GLP-1, GIP, and glucagon, after which serum and plasma were recovered and stored in aliquots at −80°C until analysis.
Analyses
C-peptide, insulin, ghrelin, leptin, adiponectin, TNF-α, PAI-1, and IL-6 were analyzed by using fluorescently labeled microsphere beads in Milliplex kits according to instructions provided by the producer (Millipore, Billerica, Massachusetts). Proinsulin was analyzed with an enzyme-linked immunosorbent assay according to the producer (Millipore), with minor in-house modifications. Analyses of total cholesterol, high-density lipoprotein cholesterol (HDL), low-density lipoprotein cholesterol (LDL), triglyceride, CRP, plasma glucose, and HbA1c were performed by using the Vitros 5.1 (Johnson & Johnson; Rochester, New York). Plasma concentrations of glucagon, GIP, and GLP-1 were measured after extraction of plasma with 70% ethanol (vol/vol, final concentration). The glucagon radioimmunoassay was directed against the C-terminus of the glucagon molecule (antibody code no. 4305).18 For the measurement of total GIP, a C-terminally directed radioimmunoassay was used.19 Plasma concentrations of total GLP-1 were measured by using antiserum code no. 89390, which is specific to the amidated C-terminus of GLP-1.20
Calculations and Statistical Analyses
The homeostasis model assessment (HOMA) was used to obtain an assessment of—mainly hepatic—insulin resistance (HOMA-IR).21 Proinsulin-to-insulin ratio was used to evaluate beta cell function.22
Statistical analyses were performed by using Statistical Package for Social Science software (SPSS, Statistics 20, IBM Corporation; Armonk, New York). Differences between patients and controls were determined by 2-tailed unpaired t tests. Within-group comparisons were performed by 2-tailed paired t tests. Potential confounding effects of familial risk of diabetes, obesity, smoking, and physical activity were controlled for in post hoc analysis of variance (ANOVA) tests. P value threshold for significance was .05. One-way ANOVA with Bonferroni post hoc test was used to explore potential differential metabolic effects of specific antipsychotic compounds where n ≥ 10. Results of these subgroup analyses are reported only where significant differences between the subgroups emerged.
RESULTS
Subject Characteristics
Of the 51 patients initially included in the study, 1 patient was excluded from further analyses because fasting plasma glucose indicated a diagnosis of diabetes (fasting plasma glucose = 19.2 mmol/L). The remaining 50 patients had clinical diagnoses of schizophrenia (n = 39), schizotypia (n = 9), other nonorganic psychosis (n = 1), or schizoid personality disorder (n = 1). Duration of illness (mean ± SD [range]) as derived from clinical records was 6.1 ± 3.8 years (0.5–15.0). As shown in Table 1, patients and controls were appropriately matched on age, waist circumference, and other anthropometric parameters. Patients and controls did not differ in familial risk of diabetes—defined as ≥ 1 first-degree relative (parent or sibling) with type 1 diabetes or type 2 diabetes. Familial risk of obesity—defined as ≥ 2 first-degree relatives (parent[s] or sibling[s]) with body mass index (BMI [kg/m2]) ≥ 30—tended to be more prominent in patients (P = .06). More patients than controls were smokers (52% vs 22%). Also, patients were less physically active than controls (P < .01). Duration of disease and BMI among patients were not correlated (Spearman r = 0.09; P = .53). As compared with controls, patients were characterized by elevated levels of fasting total cholesterol, LDL cholesterol, and triglycerides, whereas HDL cholesterol levels were lower. The HOMA-IR index was 35% higher in patients as compared with controls, but this difference did not reach significance (P = .11). Fasting CRP levels were significantly higher in patients. Fasting levels of TNF-α, PAI-1, and Il-6 did not differ between patients and controls (Table 1). After we controlled for familial risk of diabetes, familial risk of obesity, smoking, and physical activity, the differences between groups in fasting lipid levels and CRP disappeared.
Hormonal and Metabolic Parameters
Pancreatic hormones. As shown in Table 2, fasting proinsulin and C-peptide levels were significantly higher in patients compared to controls. Fasting insulin levels did not differ between the 2 groups, nor did proinsulin-to-insulin ratio (used to estimate beta cell function). Insulin, proinsulin, and C-peptide levels increased significantly after meal ingestion in both groups, with significantly higher postprandial levels of insulin, proinsulin, and C-peptide in patients compared to controls. Glucagon levels were similar in the 2 groups, but only patients exhibited a significant increase in plasma glucagon following meal ingestion.
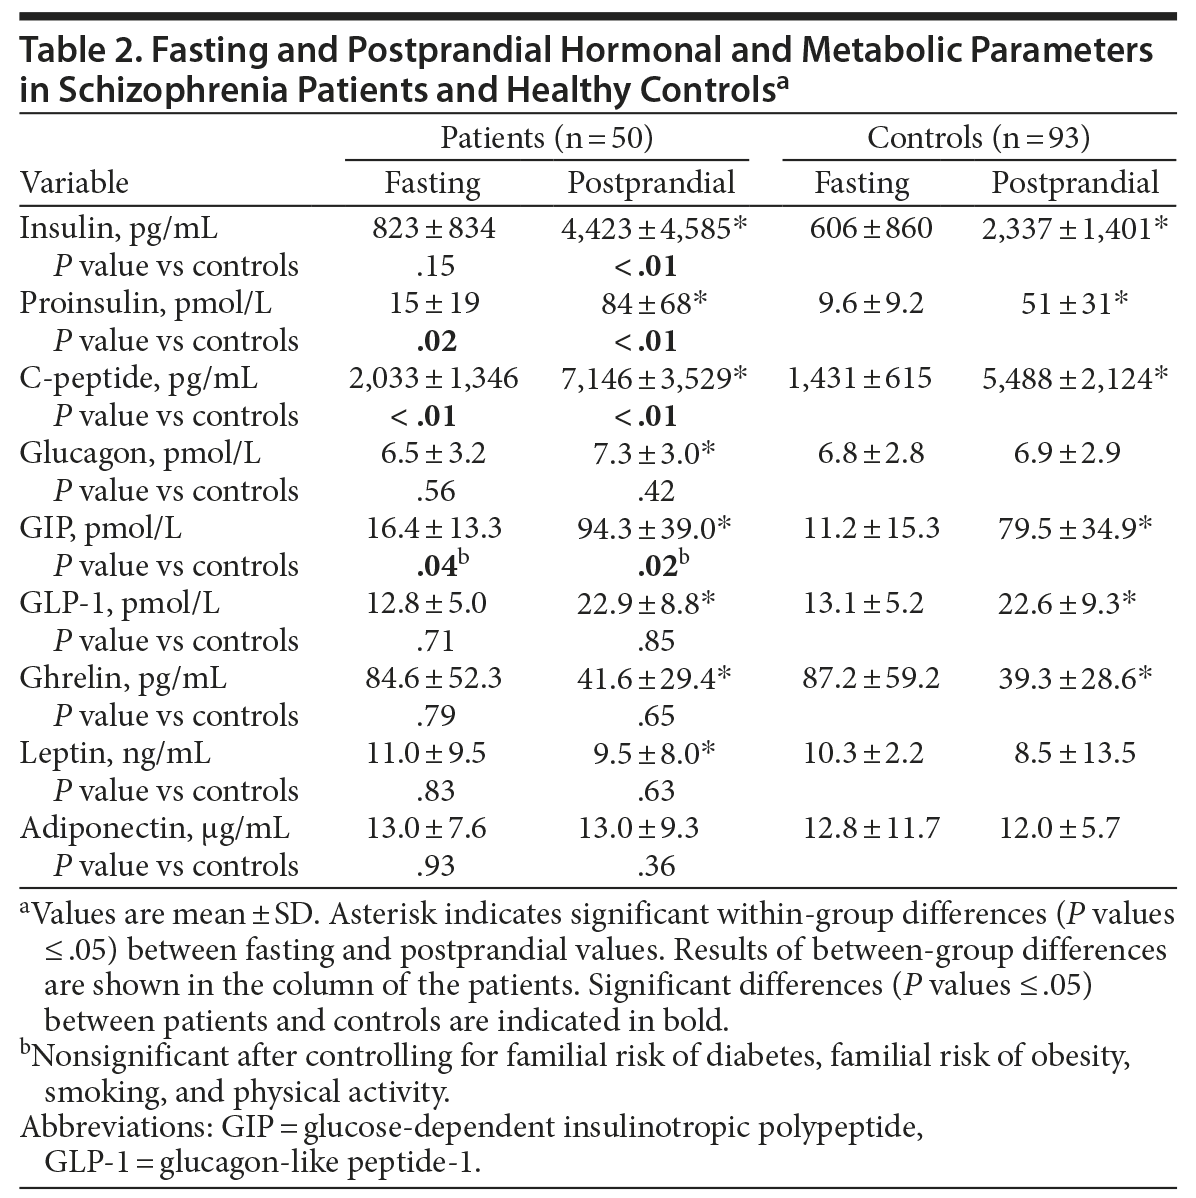
Incretin hormones. Glucose-dependent insulinotropic polypeptide levels increased significantly after meal ingestion in both groups (Table 2). Both fasting and postprandial GIP levels were higher in patients compared with controls (Table 2). Fasting plasma GLP-1 levels did not differ between groups, and both groups exhibited comparable and significant increases in GLP-1 levels after meal ingestion (Table 2).
Ghrelin. Fasting ghrelin levels did not differ between the 2 groups (Table 2). After meal ingestion, both groups exhibited comparable and significant reductions in plasma ghrelin (Table 2).
Leptin and adiponectin. Fasting leptin levels did not differ between the 2 groups (Table 2). Patients, but not controls, exhibited significantly decreased leptin levels after meal ingestion. Adiponectin levels did not differ between the 2 groups in the fasting state nor in the postprandial state (Table 2).
After we controlled for familial risk of diabetes, familial risk of obesity, smoking, and physical activity, the differences between groups in fasting and postprandial GIP disappeared. All other results were unaltered.
Effects of Specific Antipsychotics
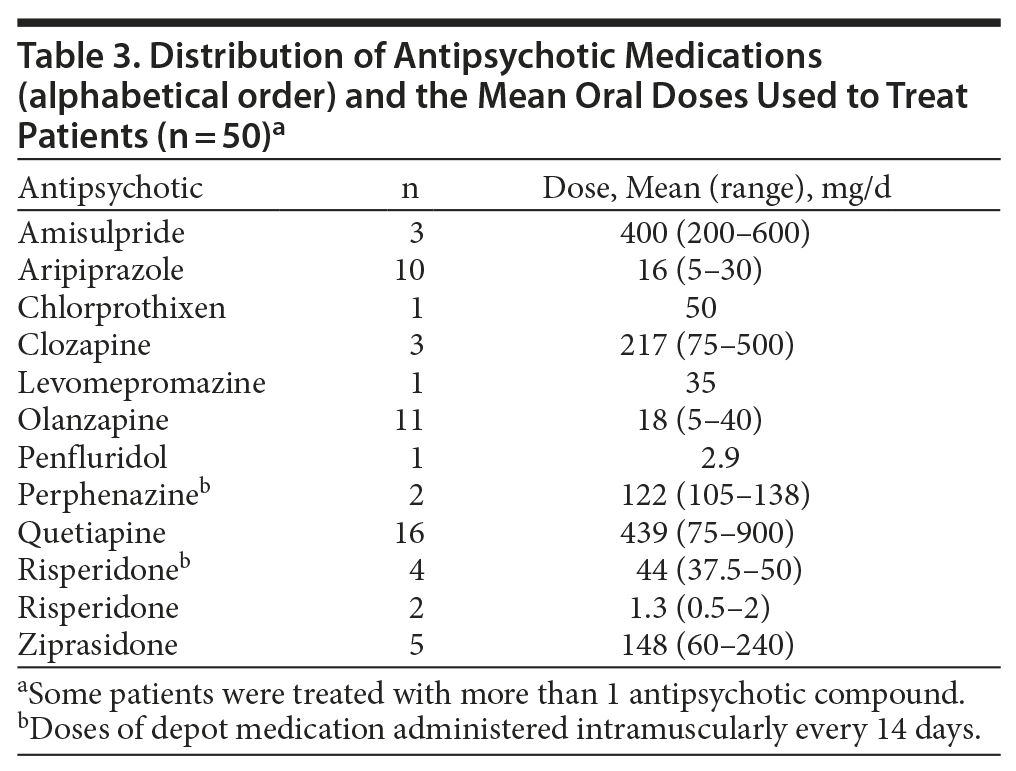
Types and mean doses of antipsychotic drugs are displayed in Table 3. To explore effects of specific antipsychotic compounds, we compared healthy controls and patients treated with aripiprazole (n = 10), olanzapine (n = 11), and quetiapine (n = 16). All parameters (fasting as well as postprandial) were evaluated. The mean fasting levels of triglycerides (ANOVA, P = .006) and fasting (P = .04) as well as postprandial (P = .002) levels of TNF-α differed significantly between the 4 groups. The post hoc Bonferroni tests showed that mean ± SD fasting triglyceride levels in olanzapine-treated patients compared with controls tended to be elevated (1.9 ± 1.1 mmol/L vs 1.3 ± 0.7 mmol/L; P = .06). Both fasting and postprandial TNF-α levels were significantly higher in aripiprazole-treated patients as compared with controls (17.9 ± 8.9 pg/mL vs 12.0 ± 5.7 pg/mL, P = .04; 20.3 ± 12.0 pg/mL vs 12.6 ± 5.6 pg/mL; P = .006). No other significant differences in mean levels of other parameters emerged from the analyses of these 3 subgroups of patients and the healthy controls.
DISCUSSION
We provide a detailed investigation of fasting and postprandial levels of incretin hormones, ghrelin, insulin, glucagon, and cardiovascular risk markers in a group of nondiabetic antipsychotic-treated patients and matched healthy controls. We found that the patients exhibited emerging signs of insulin resistance (with beta cell hypersecretion) and postprandial hyperglucagonemia, both of which are known precursors involved in the development of overt metabolic disturbances and weight gain.23,24
Our findings of altered lipid levels (elevated fasting cholesterol, LDL cholesterol, and triglycerides and lower fasting HDL cholesterol) are in agreement with observations of dyslipidemia, even in the absence of weight gain.25,26 Preclinical data have indicated that, by modulating the gene expression, antipsychotics affect the synthesis of cellular fatty acid and cholesterol.27 Thus, it is conceivable that, despite differences between human and rodent metabolism,28 modulation of genetic expression may partly explain our findings.
The elevated fasting plasma levels of the inflammatory marker CRP observed in our patients may further compromise their cardiovascular risk profile.29 However, our data do not confirm previous observations of alterations in other inflammatory markers such as TNF-α,30 PAI-1,31 and IL-632 in antipsychotic-treated patients.
In accordance with previous reports, our patients displayed higher fasting C-peptide levels.33 Although reaching only borderline significance, our patients’ mean HOMA-IR index value was 35% higher as compared with that of the healthy controls (P = .11), and, as such, resembles a pattern of emerging insulin resistance.26,34–38 To this end, our patients exhibited significantly higher fasting and postprandial proinsulin as well as postprandial C-peptide and insulin levels compared with controls. In particular, an increased level of proinsulin is considered an indication of elevated physiological stress and a compromised pancreatic beta cell function.22 However, the proinsulin-to-insulin ratio did not differ significantly between patients and controls.
In the present study, fasting glucagon levels did not differ between patients and controls. This finding is in agreement with data from olanzapine-treated (8 days) healthy subjects,39 but in contrast to a preclinical study40 in which fasting hyperglucagonemia was observed in antipsychotic-treated rats. Nevertheless, the postprandial glucagon levels increased significantly in our patients, whereas it, as expected, remained stable in the controls. This result is in contrast to the aforementioned short-term study39 of olanzapine-treated healthy subjects but in line with a recent report41 showing postprandial hyperglucagonemia after 9 days of olanzapine treatment in healthy subjects. Postprandial hyperglucagonemia may represent an early step in the development of type 2 diabetes.42 Also, postprandial hyperglucagonemia may be closely linked to the elevated postprandial GIP levels observed in our patients, which is in agreement with preclinical data.43 In addition to its glucose-dependent insulinotropic effect (incretin effect), GIP also possesses glucose-dependent glucagonotropic properties (stimulating glucagon secretion during normal-to-low plasma glucose levels).44 Our data could therefore suggest that elevated postprandial GIP levels may drive a postprandial hyperglucagonemic response in patients treated with antipsychotics. Interestingly, GIP also has adipogenic properties,45 and positive correlations between postprandial GIP levels in plasma and BMI have been reported in patients with type 2 diabetes.46 Thus, it may be speculated that elevated GIP levels may contribute to antipsychotic-induced weight gain.
The gut incretin hormone GLP-1 is pivotal for glucose homeostasis,47 and GLP-1 receptor agonists are now widely used in treatment of type 2 diabetes. Interestingly, GLP-1 receptor agonists also induce weight loss in both diabetic and nondiabetic patients,48 and they may therefore be used to treat antipsychotic-induced obesity.49–51 Endogenous GLP-1 levels have been reported in 2 studies39,41 evaluating the effect of short-term olanzapine treatment in healthy subjects: Vidarsdottir et al39 showed no effect of olanzapine, whereas Teff et al41 recently reported increases in postprandial GLP-1 levels. To our knowledge, the present study is the first to report plasma levels of endogenous GLP-1 in patients treated with antipsychotic drugs. Our data suggest that compromised GLP-1 secretion does not play a role in antipsychotic-induced dysmetabolism. This observation parallels a recent meta-analysis on GLP-1 levels in patients with type 2 diabetes.52 Previous reports41,53,54 on the effect of antipsychotics on the stimulation of the hunger-stimulating hormone ghrelin have provided inconsistent results, possibly explained by differential effects of specific antipsychotic compounds. In our study, the fasting ghrelin levels in patients were similar to those of controls, and patients were able to suppress circulating ghrelin in response to meal ingestion normally, a finding that suggests changes in ghrelin secretion should not be considered a pivotal metabolic “class effect” of antipsychotic drugs.
Studies on adipose-derived hormones have indicated a reduced secretion of adiponectin35,55 and increased levels of leptin in antipsychotic-treated patients.35,56 Yet, in a recent study,41 fasting leptin levels were unaffected by short-term treatment with antipsychotics in healthy volunteers. In the present study, we did not find significant differences in levels of adiponectin and leptin between patients and controls. Thus, the role of these adipose-derived hormones in antipsychotic-induced dysmetabolism remains to be clarified.
We acknowledge that some of the above-mentioned negative findings may represent type 2 errors that perhaps could have been avoided by including more antipsychotic-treated patients.
In our exploratory analyses of potential effects of specific antipsychotics, we observed trend-level elevated triglyceride levels in olanzapine-treated patients as compared with controls. Also, we observed that TNF-α levels were significantly higher in patients treated with aripiprazole. As such, the metabolic profiles of our patients treated with specific antipsychotic drugs do not support that the dysmetabolic effect of olanzapine is substantially more pronounced than that of aripiprazole41 and quetiapine.6 This finding, which is in contrast to previous reports, may be explained by the cross-sectional, naturalistic design and the limited sizes of our patient subgroups.
Although patients and controls were well matched on our a priori inclusion criteria, the metabolic perturbations appeared only partially explained by familial risk of diabetes, obesity, smoking, and physical activity. This could suggest that antipsychotic exposure is an independent contributor to dysmetabolism in schizophrenia spectrum patients. Duration of illness and BMI were not correlated, yet we cannot exclude that the duration of antipsychotic treatment or other factors, such as dietary habits, may also have influenced the findings. Hence, it should be emphasized that our findings reveal associations between dysmetabolism and antipsychotic exposure, rather than provide proof of a causal relationship.
Another limitation of the present study is that our broadly defined “schizophrenia spectrum” hampers inferences regarding potential interactions between specific psychiatric diagnoses and the liability to acquire metabolic disturbances.57 Moreover, we included only chronic male patients in this study. Since previous studies35,58,59 have indicated gender differences in antipsychotic-induced dysmetabolism, our findings may not be readily applied on a female population. Except for the absence of gender effects, our naturalistic study design and consecutive enrollment of subjects increase the external validity of the present study.
Finally, some of the observed discrepancies between the present and previous studies may partly be explained by methodological differences. First, we have only 1 measurement in the postprandial phase. Clearly, several measurements would have been optimal,41 but, in order to increase the recruitment of patients, that design was judged unviable. Second, since not all cytokines are stable, we addressed potential proteolysis by protecting our blood samples from endogenous proteases by immediately adding protease inhibitors to all samples. This potential error factor is otherwise almost impossible to account for, as individual analytes will be degraded at different rates, and therefore our preventive procedure may explain some of the conflicting findings.
In conclusion, the present study shows that nondiabetic antipsychotic-treated patients display an insulin resistant–like pattern, with beta cell hypersecretion, postprandial hyperglucagonemia, and elevated GIP levels, indicating emerging signs of dysmetabolism and a compromised cardiovascular risk profile. The appetite-regulating hormones GLP-1 and ghrelin appear not to be influenced by antipsychotic treatment. Thus, our findings provide new clinical insight into the pathophysiology associated with metabolic side effects of antipsychotic treatment and put emphasis on the importance of implementing metabolic screening into psychiatric practice.60
Drug names: aripiprazole (Abilify), clozapine (Clozaril, FazaClo, and others), olanzapine (Zyprexa and others), quetiapine (Seroquel and others), risperidone (Risperdal and others), ziprasidone (Geodon and others).
Author affiliations: Psychiatric Centre Glostrup, Copenhagen University Hospitals, Mental Health Services, Capital Region of Denmark (Dr Ebdrup and Ms Madsen); Centre for Neuropsychiatric Schizophrenia Research (CNSR) and Centre for Clinical Intervention and Neuropsychiatric Schizophrenia Research (CINS), Psychiatric Centre Glostrup (Drs Ebdrup and Lublin), Glostrup; Diabetes Research Division, Department of Internal Medicine (Dr Knop); Department of Clinical Biochemistry (Dr Szecsi), Gentofte Hospital, University of Copenhagen, Hellerup; Department of Biomedical Sciences, NNF Center for Basic Metabolic Research (Drs Knop and Holst); Department of Pediatrics, Herlev Hospital (Dr Mortensen), University of Copenhagen, Copenhagen; and Department of Clinical Pharmacology, Lundbeck A/S, Valby (Ms Søgaard), Denmark.
Author contributions: Drs Ebdrup and Knop contributed equally to this article. Dr Lublin conceived and initiated the study. Dr Lublin was responsible for evaluation of any potential discomfort and/or risk associated with participation in the study, thus ensuring the health and safety of the participating subjects. Furthermore, Dr Lublin was responsible for study conduct according to local, national, and international guidelines and laws.
Potential conflicts of interest: Dr Ebdrup has received lecture fees from Bristol-Myers Squibb, Otsuka Pharma Scandinavia AB, Eli Lilly, and Takeda and is part of the advisory board of Eli Lilly Denmark A/S and Takeda. Dr Knop has received research funding from Sanofi-Aventis Deutschland GmbH and lecture fees from AstraZeneca, Boehringer Ingelheim, Bristol-Myers Squibb, Eli Lilly, Gilead Sciences, Merck Sharp & Dohme, Novo Nordisk, Sanofi, and Zealand Pharma; is part of the advisory boards of Eli Lilly Denmark, Bristol-Myers Squibb, AstraZeneca, and Zealand Pharma; and has consulted for AstraZeneca, Gilead Sciences, Ono Pharmaceuticals, and Zealand Pharma. Dr Holst has received research funding and honoraria for consulting and/or lecture fees from Novo Nordisk A/S. Dr Lublin has received honoraria from and is part of the speakers and/or advisory board of Destin Pharma A/S Denmark and Janssen-Cilag A/S Denmark. Ms Søgaard is an employee of Lundbeck A/S. Drs Mortensen and Szecsi and Ms Madsen have no conflicts of interest to report.
Funding/support: The study was supported by an unrestricted grant from Lundbeck A/S (Valby, Denmark). Specifically, laboratory analyses, compensation for (public) transport and salary for laboratory staff, and analyses were financed through this grant.
Role of the sponsor: Lundbeck A/S, as represented by Ms Søgaard, was partly involved in the design of the study (regarding the selection of relevant blood samples).
Acknowledgments: The authors are grateful to all patients and healthy volunteers, who participated in the study. Collaborating District Psychiatric Centers in the Capital Region of Copenhagen are thanked for all referrals.
References
1. Leucht S, Tardy M, Komossa K, et al. Antipsychotic drugs versus placebo for relapse prevention in schizophrenia: a systematic review and meta-analysis. Lancet. 2012;379(9831):2063–2071. doi:10.1016/S0140-6736(12)60239-6 PubMed
2. Newcomer JW, Hennekens CH. Severe mental illness and risk of cardiovascular disease. JAMA. 2007;298(15):1794–1796. doi:10.1001/jama.298.15.1794 PubMed
3. Rummel-Kluge C, Komossa K, Schwarz S, et al. Head-to-head comparisons of metabolic side effects of second generation antipsychotics in the treatment of schizophrenia: a systematic review and meta-analysis. Schizophr Res. 2010;123(2–3):225–233. doi:10.1016/j.schres.2010.07.012 PubMed
4. Bobo WV, Cooper WO, Stein CM, et al. Antipsychotics and the risk of type 2 diabetes mellitus in children and youth. JAMA Psychiatry. 2013;70(10):1067–1075. PubMed
5. Asenjo Lobos C, Komossa K, Rummel-Kluge C, et al. Clozapine versus other atypical antipsychotics for schizophrenia. Cochrane Database Syst Rev. 2010;CD006633. PubMed
6. Komossa K, Rummel-Kluge C, Hunger H, et al. Olanzapine versus other atypical antipsychotics for schizophrenia. Cochrane Database Syst Rev. 2010;(3):CD006654. doi:10.1002/14651858.cd006654.pub2 PubMed
7. Alberti KG, Zimmet P, Shaw J; IDF Epidemiology Task Force Consensus Group. The metabolic syndrome—a new worldwide definition. Lancet. 2005;366(9491):1059–1062. doi:10.1016/S0140-6736(05)67402-8 PubMed
8. Alberti KG, Eckel RH, Grundy SM, et al; International Association for the Study of Obesity. Harmonizing the metabolic syndrome: a joint interim statement of the International Diabetes Federation Task Force on Epidemiology and Prevention; National Heart, Lung, and Blood Institute; American Heart Association; World Heart Federation; International Atherosclerosis Society; and International Association for the Study of Obesity. Circulation. 2009;120(16):1640–1645. doi:10.1161/CIRCULATIONAHA.109.192644 PubMed
9. De HertM, Detraux J, van Winkel R, et al. Metabolic and cardiovascular adverse effects associated with antipsychotic drugs. Nat Rev Endocrinol. 2012;8:114–126.
10. Hoang U, Stewart R, Goldacre MJ. Mortality after hospital discharge for people with schizophrenia or bipolar disorder: retrospective study of linked English hospital episode statistics, 1999–2006. BMJ. 2011;343(1):d5422. doi:10.1136/bmj.d5422 PubMed
11. Nordentoft M, Wahlbeck K, Hällgren J, et al. Excess mortality, causes of death and life expectancy in 270,770 patients with recent onset of mental disorders in Denmark, Finland and Sweden. PLoS ONE. 2013;8(1):e55176. doi:10.1371/journal.pone.0055176 PubMed
12. Orci L, Unger RH. Functional subdivision of islets of Langerhans and possible role of D cells. Lancet. 1975;306(7947):1243–1244. doi:10.1016/S0140-6736(75)92078-4 PubMed
13. Gutniak M, Orskov C, Holst JJ, et al. Antidiabetogenic effect of glucagon-like peptide-1 (7–36)amide in normal subjects and patients with diabetes mellitus. N Engl J Med. 1992;326(20):1316–1322. doi:10.1056/NEJM199205143262003 PubMed
14. Campbell JE, Drucker DJ. Pharmacology, physiology, and mechanisms of incretin hormone action. Cell Metab. 2013;17(6):819–837. doi:10.1016/j.cmet.2013.04.008 PubMed
15. van der Lely AJ, Tschöp M, Heiman ML, et al. Biological, physiological, pathophysiological, and pharmacological aspects of ghrelin. Endocr Rev. 2004;25(3):426–457. doi:10.1210/er.2002-0029 PubMed
16. DeBoer MD. Obesity, systemic inflammation, and increased risk for cardiovascular disease and diabetes among adolescents: a need for screening tools to target interventions. Nutrition. 2013;29(2):379–386. doi:10.1016/j.nut.2012.07.003 PubMed
17. Phillips CM, Perry IJ. Does inflammation determine metabolic health status in obese and nonobese adults? J Clin Endocrinol Metab. 2013;98(10):E1610–E1619. doi:10.1210/jc.2013-2038 PubMed
18. Holst JJ. Evidence that enteroglucagon (II) is identical with the C-terminal sequence (residues 33-69) of glicentin. Biochem J. 1982;207(3):381–388. PubMed
19. Krarup T, Madsbad S, Moody AJ, et al. Diminished immunoreactive gastric inhibitory polypeptide response to a meal in newly diagnosed type I (insulin-dependent) diabetics. J Clin Endocrinol Metab. 1983;56(6):1306–1312. doi:10.1210/jcem-56-6-1306 PubMed
20. Orskov C, Rabenhøj L, Wettergren A, et al. Tissue and plasma concentrations of amidated and glycine-extended glucagon-like peptide I in humans. Diabetes. 1994;43(4):535–539. doi:10.2337/diab.43.4.535 PubMed
21. Matthews DR, Hosker JP, Rudenski AS, et al. Homeostasis model assessment: insulin resistance and beta-cell function from fasting plasma glucose and insulin concentrations in man. Diabetologia. 1985;28(7):412–419. doi:10.1007/BF00280883 PubMed
22. Tura A, Pacini G, Kautzky-Willer A, et al. Basal and dynamic proinsulin-insulin relationship to assess beta-cell function during OGTT in metabolic disorders. Am J Physiol Endocrinol Metab. 2003;285(1):E155–E162. PubMed
23. Faerch K, Vaag A, Holst JJ, et al. Natural history of insulin sensitivity and insulin secretion in the progression from normal glucose tolerance to impaired fasting glycemia and impaired glucose tolerance: the Inter99 study. Diabetes Care. 2009;32(3):439–444. doi:10.2337/dc08-1195 PubMed
24. Knop FK, Aaboe K, Vilsbøll T, et al. Impaired incretin effect and fasting hyperglucagonaemia characterizing type 2 diabetic subjects are early signs of dysmetabolism in obesity. Diabetes Obes Metab. 2012;14(6):500–510. doi:10.1111/j.1463-1326.2011.01549.x PubMed
25. Vik-Mo AO, Birkenaes AB, Fernø J, et al. Increased expression of lipid biosynthesis genes in peripheral blood cells of olanzapine-treated patients. Int J Neuropsychopharmacol. 2008;11(5):679–684. doi:10.1017/S1461145708008468 PubMed
26. Vidarsdottir S, Vlug P, Roelfsema F, et al. Orally disintegrating and oral standard olanzapine tablets similarly elevate the homeostasis model assessment of insulin resistance index and plasma triglyceride levels in 12 healthy men: a randomized crossover study. J Clin Psychiatry. 2010;71(9):1205–1211. doi:10.4088/JCP.08m04654yel PubMed
27. Ferno J, Skrede S, Vik-Mo AO, et al. Lipogenic effects of psychotropic drugs: focus on the SREBP system. Front Biosci (Landmark Ed). 2011;16(1):49–60. doi:10.2741/3675 PubMed
28. Mann S, Chintoh A, Giacca A, et al. Chronic olanzapine administration in rats: effect of route of administration on weight, food intake and body composition. Pharmacol Biochem Behav. 2013;103(4):717–722. doi:10.1016/j.pbb.2012.12.002 PubMed
29. Grad E, Danenberg HD. C-reactive protein and atherothrombosis: cause or effect? Blood Rev. 2013;27(1):23–29. doi:10.1016/j.blre.2012.12.001 PubMed
30. Chen SL, Lee SY, Chang YH, et al. Inflammation in patients with schizophrenia: the therapeutic benefits of risperidone plus add-on dextromethorphan. J Neuroimmune Pharmacol. 2012;7(3):656–664. doi:10.1007/s11481-012-9382-z PubMed
31. Carrizo E, Fernández V, Quintero J, et al. Coagulation and inflammation markers during atypical or typical antipsychotic treatment in schizophrenia patients and drug-free first-degree relatives. Schizophr Res. 2008;103(1–3):83–93. doi:10.1016/j.schres.2008.03.004 PubMed
32. Löffler S, Klimke A, Kronenwett R, et al. Clozapine mobilizes CD34+ hematopoietic stem and progenitor cells and increases plasma concentration of interleukin 6 in patients with schizophrenia. J Clin Psychopharmacol. 2010;30(5):591–595. doi:10.1097/JCP.0b013e3181eeb7f7 PubMed
33. Wu RR, Zhao JP, Liu ZN, et al. Effects of typical and atypical antipsychotics on glucose-insulin homeostasis and lipid metabolism in first-episode schizophrenia. Psychopharmacology (Berl). 2006;186(4):572–578. doi:10.1007/s00213-006-0384-5 PubMed
34. Wu MK, Huang CY, Liou YJ, et al. Glucose-insulin homeostasis, lipid profiles and GH-IGF-IGFBP axis in clozapine-treated schizophrenic obesity versus non-psychiatric obesity. Int J Obes (Lond). 2008;32(3):436–442. doi:10.1038/sj.ijo.0803750 PubMed
35. Birkenaes AB, Birkeland KI, Friis S, et al. Hormonal markers of metabolic dysregulation in patients with severe mental disorders after olanzapine treatment under real-life conditions. J Clin Psychopharmacol. 2009;29(2):109–116. doi:10.1097/JCP.0b013e31819b95fc PubMed
36. Henderson DC, Copeland PM, Borba CP, et al. Glucose metabolism in patients with schizophrenia treated with olanzapine or quetiapine: a frequently sampled intravenous glucose tolerance test and minimal model analysis. J Clin Psychiatry. 2006;67(5):789–797. doi:10.4088/JCP.v67n0513 PubMed
37. Newcomer JW, Ratner RE, Eriksson JW, et al. A 24-week, multicenter, open-label, randomized study to compare changes in glucose metabolism in patients with schizophrenia receiving treatment with olanzapine, quetiapine, or risperidone. J Clin Psychiatry. 2009;70(4):487–499. doi:10.4088/JCP.08m04132 PubMed
38. Haupt DW, Fahnestock PA, Flavin KA, et al. Adiposity and insulin sensitivity derived from intravenous glucose tolerance tests in antipsychotic-treated patients. Neuropsychopharmacology. 2007;32(12):2561–2569. doi:10.1038/sj.npp.1301392 PubMed
39. Vidarsdottir S, Roelfsema F, Streefland T, et al. Short-term treatment with olanzapine does not modulate gut hormone secretion: olanzapine disintegrating versus standard tablets. Eur J Endocrinol. 2010;162(1):75–83. doi:10.1530/EJE-09-0433 PubMed
40. Smith GC, Vickers MH, Shepherd PR. Olanzapine effects on body composition, food preference, glucose metabolism and insulin sensitivity in the rat. Arch Physiol Biochem. 2011;117(4):241–249. doi:10.3109/13813455.2011.576681 PubMed
41. Teff KL, Rickels MR, Grudziak J, et al. Antipsychotic-induced insulin resistance and postprandial hormonal dysregulation independent of weight gain or psychiatric disease. Diabetes. 2013;62(9):3232–3240. doi:10.2337/db13-0430 PubMed
42. Faerch K, Vaag A, Holst JJ, et al. Impaired fasting glycaemia vs impaired glucose tolerance: similar impairment of pancreatic alpha and beta cell function but differential roles of incretin hormones and insulin action. Diabetologia. 2008;51(5):853–861. doi:10.1007/s00125-008-0951-x PubMed
43. Sondhi S, Castellano JM, Chong VZ, et al. cDNA array reveals increased expression of glucose-dependent insulinotropic polypeptide following chronic clozapine treatment: role in atypical antipsychotic drug-induced adverse metabolic effects. Pharmacogenomics J. 2006;6(2):131–140. doi:10.1038/sj.tpj.6500346 PubMed
44. Christensen M, Vedtofte L, Holst JJ, et al. Glucose-dependent insulinotropic polypeptide: a bifunctional glucose-dependent regulator of glucagon and insulin secretion in humans. Diabetes. 2011;60(12):3103–3109. doi:10.2337/db11-0979 PubMed
45. Ugleholdt R, Pedersen J, Bassi MR, et al. Transgenic rescue of adipocyte glucose-dependent insulinotropic polypeptide receptor expression restores high fat diet-induced body weight gain. J Biol Chem. 2011;286(52):44632–44645. doi:10.1074/jbc.M111.311779 PubMed
46. Kamoi K, Shinozaki Y, Furukawa K, et al. Potential correlation between plasma total GIP levels and body mass index in Japanese patients with types 1 or 2 diabetes mellitus. Endocr J. 2012;59(4):353–363. doi:10.1507/endocrj.EJ11-0245 PubMed
47. Holst JJ. The physiology of glucagon-like peptide 1. Physiol Rev. 2007;87(4):1409–1439. doi:10.1152/physrev.00034.2006 PubMed
48. Vilsbøll T, Christensen M, Junker AE, et al. Effects of glucagon-like peptide-1 receptor agonists on weight loss: systematic review and meta-analyses of randomised controlled trials. BMJ. 2012;344(2):d7771. doi:10.1136/bmj.d7771 PubMed
49. Ebdrup BH, Knop FK, Ishøy PL, et al. Glucagon-like peptide-1 analogs against antipsychotic-induced weight gain: potential physiological benefits. BMC Med. 2012;10(1):92. doi:10.1186/1741-7015-10-92 PubMed
50. Ishøy PL, Knop FK, Vilsbøll T, et al. Sustained weight loss after treatment with a glucagon-like peptide-1 receptor agonist in an obese patient with schizophrenia and type 2 diabetes. Am J Psychiatry. 2013;170(6):681–682. doi:10.1176/appi.ajp.2013.12101344 PubMed
51. Ishøy PL, Knop FK, Broberg BV, et al. Treatment of antipsychotic-associated obesity with a GLP-1 receptor agonist—protocol for an investigator-initiated prospective, randomised, placebo-controlled, double-blinded intervention study: the TAO study protocol. BMJ Open. 2014;4(1):e004158. doi:10.1136/bmjopen-2013-004158 PubMed
52. Calanna S, Christensen M, Holst JJ, et al. Secretion of glucagon-like peptide-1 in patients with type 2 diabetes mellitus: systematic review and meta-analyses of clinical studies. Diabetologia. 2013;56(5):965–972. doi:10.1007/s00125-013-2841-0 PubMed
53. Sentissi O, Epelbaum J, Olié JP, et al. Leptin and ghrelin levels in patients with schizophrenia during different antipsychotics treatment: a review. Schizophr Bull. 2008;34(6):1189–1199. doi:10.1093/schbul/sbm141 PubMed
54. Esen-Danaci A, Sarandöl A, Taneli F, et al. Effects of second generation antipsychotics on leptin and ghrelin. Prog Neuropsychopharmacol Biol Psychiatry. 2008;32(6):1434–1438. doi:10.1016/j.pnpbp.2008.03.015 PubMed
55. Bai YM, Chen JY, Yang WS, et al. Adiponectin as a potential biomarker for the metabolic syndrome in Chinese patients taking clozapine for schizophrenia. J Clin Psychiatry. 2007;68(12):1834–1839. doi:10.4088/JCP.v68n1202 PubMed
56. Zhang ZJ, Yao ZJ, Liu W, et al. Effects of antipsychotics on fat deposition and changes in leptin and insulin levels: magnetic resonance imaging study of previously untreated people with schizophrenia. Br J Psychiatry. 2004;184(1):58–62. doi:10.1192/bjp.184.1.58 PubMed
57. van Welie H, Derks EM, Verweij KH, et al. The prevalence of diabetes mellitus is increased in relatives of patients with a non-affective psychotic disorder. Schizophr Res. 2013;143(2–3):354–357. doi:10.1016/j.schres.2012.11.011 PubMed
58. Wu RR, Zhao JP, Zhai JG, et al. Sex difference in effects of typical and atypical antipsychotics on glucose-insulin homeostasis and lipid metabolism in first-episode schizophrenia. J Clin Psychopharmacol. 2007;27(4):374–379. doi:10.1097/JCP.0b013e3180cac8db PubMed
59. Patel JK, Buckley PF, Woolson S, et al; CAFE Investigators. Metabolic profiles of second-generation antipsychotics in early psychosis: findings from the CAFE study. Schizophr Res. 2009;111(1–3):9–16. doi:10.1016/j.schres.2009.03.025 PubMed
60. Mitchell AJ, Delaffon V, Vancampfort D, et al. Guideline concordant monitoring of metabolic risk in people treated with antipsychotic medication: systematic review and meta-analysis of screening practices. Psychol Med. 2012;42(1):125–147. doi:10.1017/S003329171100105X PubMed