ABSTRACT
Objective: Although the populations of patients with functional seizures (FS) and epileptic seizures (ES) are extremely heterogeneous with multiple etiologies and phenotypes, patients with FS have increased somatic sensitivity and report more positive complaints on review-of-systems questionnaires (ROSQs). We evaluated if data-driven clustering and projection analysis could identify symptom phenotypes that could differentiate between patients with FS and ES.
Methods: The dataset included all adult patients admitted from January 2006 to March 2020 for video-electroencephalography with available ROSQs (N = 877). Latent clusters and axes of variation in ROSQ responses were evaluated using multiple well-established methods. Leave-one-out cross-validation was used to evaluate if logistic regression using information could differentiate patients with FS from ES.
Results: When evaluating individual symptom response and proportion of positive responses, the area under the receiver operating curve (AUC) was 62% (95% CI, 53%–69%) and 72% (CI, 65%–78%), respectively. The best AUC achieved by phenotyping methods was 74%. The patterns of clusters and components reflected properties of each analysis and did not correlate with assigned “system” from the ROSQ or other interpretations.
Discussion: The overall proportion of positive responses was the most informative metric to differentiate patients with FS compared to ES. While both FS and ES are heterogeneous populations with multiple subgroups, these subgroups were not meaningfully identified based on ROSQ symptoms. The limited overall predictive accuracy and AUC suggests that, in absence of other supporting data, ROSQ responses in patients with FS and ES were not clinically useful for screening.
Prim Care Companion CNS Disord 2022;24(2):21m03049
To cite: Kerr WT, Allas CH, Sreenivasan SS, et al. Phenotyping of review-of-systems responses to differentiate functional seizures from epilepsy. Prim Care Companion CNS Disord. 2022;24(2):21m03049.
To share: https://doi.org/10.4088/PCC.21m03049
© Copyright 2022 Physicians Postgraduate Press, Inc.
aDepartment of Neurology, David Geffen School of Medicine at University of California Los Angeles, Los Angeles, California
bDepartment of Psychiatry and Biobehavioral Sciences, University of California Los Angeles, Los Angeles, California
cDepartment of Neurology, University of Michigan, Ann Arbor, Michigan
dDepartment of Neurobiology, David Geffen School of Medicine at UCLA, Los Angeles, California
eBrain Research Institute, University of California Los Angeles, Los Angeles, California
fCentre for Addiction and Mental Health, Toronto, Canada
gDepartment of Psychiatry, University of Toronto, Toronto, Canada
hDepartment of Women’s and Children’s Health, Karolinska Institutet, Stockholm, Sweden
*Corresponding author: Wesley T. Kerr, MD, PhD, 710 Westwood Plaza, Room, Ste 1-240, Box 951769, Los Angeles, California 90095 ([email protected]).
Otherwise known as dissociative or psychogenic nonepileptic seizures, functional seizures (FS) are characterized by episodic separation of the patient from awareness or conscious control of their body or sensations.1–3 These paroxysmal events may appear similar to epileptic seizures (ES), but they are not caused by abnormal epileptic neural activity.4 In the years prior to the diagnosis of FS, 50%–90% of patients with FS were treated initially with antiseizure medications that target epileptic neural activity.4,5 Following correction of the diagnosis from ES to FS, patients have improvements in quality of life and seizure frequency and decreases in health care utilization.6–8
To facilitate prompt and accurate diagnosis, we evaluate how review-of-systems questionnaires (ROSQs) can identify patients with FS. In the United States prior to 2021, the Centers for Medicare and Medicaid Services (CMS) regulations for billing documentation required broad ROS questions or questionnaires that systematically survey a patient’s current symptoms as part of medical evaluations in many specialties including primary care, neurology, and psychiatry. Prior studies have shown that patients with FS report more symptoms on these questionnaires.9–11 Potential explanations for this are that patients with FS may experience symptoms from common comorbidities, nonseizure functional symptoms, or increased somatic sensitivity that appears on ROSQs.4,9,12–16
The population of patients with FS is heterogenous. While a majority of patients have mental health comorbidities or history of psychological trauma, some patients with functional neurologic disorders do not.17,18 Because the function of ROSQs is to broadly evaluate symptoms across multiple organ systems, we hypothesized that data-driven methods could identify meaningful symptom phenotypes or subgroups such as chronic pain, depression, or trauma. To validate if the symptom phenotypes proposed by these data-driven methods were meaningful, we evaluated if this information could be used to differentiate patients with FS from those with ES.
METHODS
This study was a single site, retrospective analysis of both clinically available and systematically collected ROSQ data from patients admitted for video-electroencephalographic (vEEG) monitoring between January 2006 and March 2020. We assessed the utility of clustering and projectional methods to identify meaningful subpopulations and patterns of responses. We evaluated if these data-driven analyses identified different patterns in patients with FS, ES, and other mutually exclusive groups including mixed nonepileptic and epileptic seizures, physiologic nonepileptic seizure-like episodes (PSLE), and inconclusive monitoring. All patients consented for the use of their records in research, and the UCLA Institutional Review Board approved this study. This work is consistent with Declaration of Helsinki. Deidentified raw data and code for this study is available at https://seizuredisordercenterresearchgroup.org/.
All patients underwent vEEG monitoring at a level 4 comprehensive epilepsy center. Diagnosis of functional seizure as compared to epileptic seizure met the International League Against Epilepsy criteria for “documented”12 and was from expert clinical opinion based on the available clinical history, physical examination, ictal vEEG, and structural magnetic resonance imaging. We keep patients with mixed FS plus ES separate from patients with FS because, while both have FS, there is insufficient evidence to suggest that the mechanism and risk factors for FS are the same in these populations.19 Inconclusive vEEG monitoring occurred when patients did not experience sufficient characteristic events during monitoring to yield a definitive diagnosis. Patients were excluded from analysis if no ROSQ was available. There were no other exclusion criteria.
At our institution, the typical practice for vEEG monitoring was elective, but sometimes emergent, admission for long-term vEEG monitoring for 7 to 10 days, or until sufficient seizures were captured to address the reason for vEEG monitoring including differential diagnosis of seizure-like events, presurgical evaluation of medication-resistant epilepsy, or other indications. Diagnoses were determined by expert clinical opinion of clinical neurophysiology or epilepsy fellows and supervising epileptologists, with additional review of patients admitted for presurgical evaluation by a multidisciplinary team including multiple epileptologists, functional neurosurgeons, neuroradiologists, neuropsychologists, and others. If patients underwent multiple vEEG monitoring admissions (eg, for inconclusive initial monitoring), only the first ROSQ was used for analysis, but the diagnosis was determined based on all available data from all vEEG monitoring admissions.
All patients or their caregivers filled out a standardized 78-item ROSQ (Supplementary Figure 1). This included spaces to indicate if patients had symptoms from any of the 14 organ systems defined by CMS. There were 2 minor variations of the standard form: 1 form omitted 3 items (75 total items) and the other omitted the same 3 items while splitting 1 item into 2 separate items (76 total items). These variations were included in the total percent of symptoms noted analysis. To avoid missing data, these alternate forms were excluded from clustering analysis. Patients or caregivers signed each form to differentiate blank forms from missing data and indicate who filled out the form, as well as their relationship to the patient. When multiple forms were available, only the first was used. Patients with no available forms were excluded.
ROSQs were available through retrospective chart review for records between January 2006 and April 2015, whereas they were offered prospectively from May 2015 to March 2020. In the retrospective patient group, patients or their caregivers filled out ROSQs in the outpatient neurology waiting room prior to their appointment or at home as part of the admission packet sent to them prior to vEEG admission. Alternatively, if the patient had not filled out their ROSQ prior to vEEG, they were given another form during admission, and the form was collected by nursing staff. ROSQs from patients admitted after April 2015 were collected in person within 48 hours of vEEG admission by study staff. If the patient had not filled out the form, the patient was provided another form, and the staff returned later to collect the form. The goal of prospective data collection was to reduce the potential for selection bias from missing data.
We analyzed the ROSQ responses using multiple clustering and projection methods to identify symptom phenotypes or dimensions of variation within this patient population. Due to the unsupervised nature of clustering, we included all patients irrespective of diagnosis or certainty of diagnosis to provide algorithms with the maximum sample size to find patterns. We then evaluated if this data-driven representation was meaningful by assessing if fully supervised learning can be utilized to differentiate patients with FS from ES.
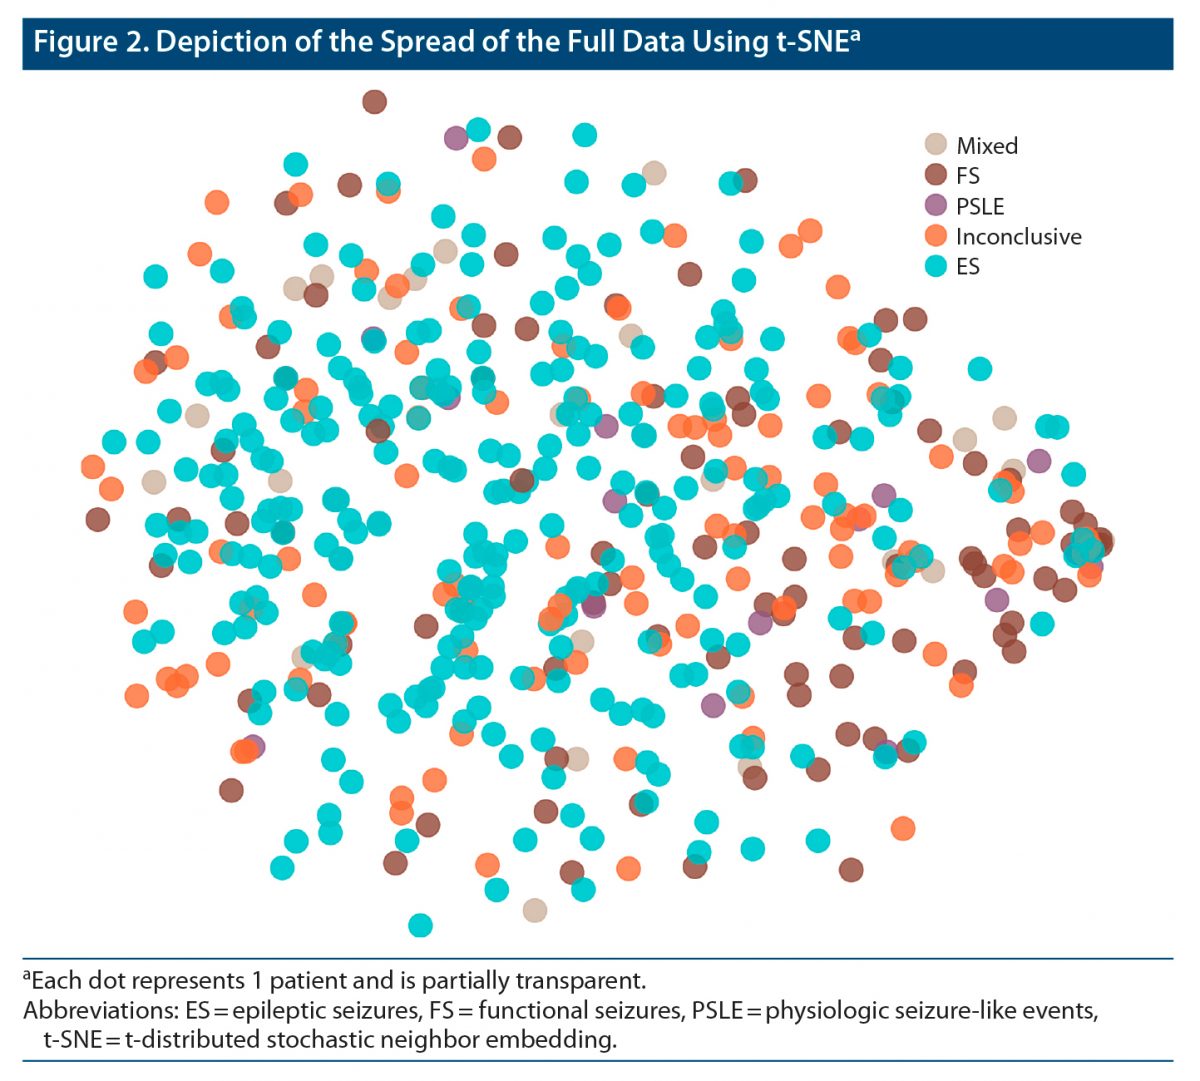
Each of the multiple clustering and projectional methods represent a different perspective on how to understand the underlying patterns in the data and how to quantify differences between individual patient data. We used k-medoids, latent class analysis, density-based spatial clustering of applications with noise, principal component analysis, and independent component analysis. We graphically depict our data using t-distributed Stochastic Neighbor Embedding (t-SNE)20 but did not evaluate its utility formally due to its similarity to other nearest-neighbors techniques. While this does not include all available clustering methods, it represents a selection of common algorithms with varying perspectives on how to understand the data. We briefly describe each algorithm to highlight these differences in perspectives in the Supplementary Methods.
The differentiation between patients with FS and those with ES was determined by fitting a logistic regression (LR) model using cluster identity or loading on components as independent variables to predict diagnosis of FS or ES. Due to the relatively small number of clusters and the Gaussian nature of many projectional techniques, we felt that LR was appropriate and that more complex supervised algorithms (eg, neural networks) would recreate or complicate phenotype interpretation.
We compared these models to the performance of nonphenotypic LR models based on (1) the response to each individual symptom, (2) recursive feature elimination (RFE) applied to the individual symptom model, and (3) a single independent variable of the percent of symptoms marked as positive. In RFE, we start with the full LR model, then sequentially exclude any symptoms with Wald P < 5% until all symptoms have P < 5%.21 Each LR model was trained using leave-one-out cross-validation wherein clustering and RFE were performed on the training set alone.22 The confidence intervals of all performance statistics are calculated with binomial exact confidence intervals except area under the receiver operating curve (AUC) that used the Wald interval method.23
Only data from patients with FS or ES alone were used to train each LR model, whereas data from mixed, PSLE, and inconclusive monitoring also were used to define clusters and projectional representations. For graphical depiction of the models and interpretation of the cluster assignments, we used all data. Therefore, individual leave-one-out cross-validation models would vary slightly from these depicted models.
RESULTS
Patient age ranged from 18 to 88 years old, and 60% reported female sex. The demographic differences in this dataset are similar to prior publications including this dataset (Table 1).24–26 In total, 565 long-form ROSQs were available, of which 408 had FS or ES (92 and 316, respectively). Long-form ROSQs were available for 26, 17, and 114 patients with mixed, PSLE, and inconclusive monitoring, respectively. The trend of diagnostic class with respect to percent positive symptoms is illustrated in Figure 1.
ROSQs were available for 877 (54%) patients who underwent vEEG monitoring during this 14-year time period, of which 684 ROSQs were from patients with ES or FS (519 and 165, respectively). Of these 684 ROSQs, we excluded 312 short-form ROSQs. The person completing the form was indicated in 772 of 877 (88%) forms. Someone other than the patient filled out 163 (21%) of these forms. This person was a first-degree relative or significant other for 146 (90%) of the forms. There were no significant patterns in the total number of symptoms, the rate of reporting an individual symptom, or clusters within any of the clustering results based on person who completed the form (self, caregiver, first-degree relative, unknown) or setting where the form was completed (retrospective clinic, retrospective inpatient, prospective).
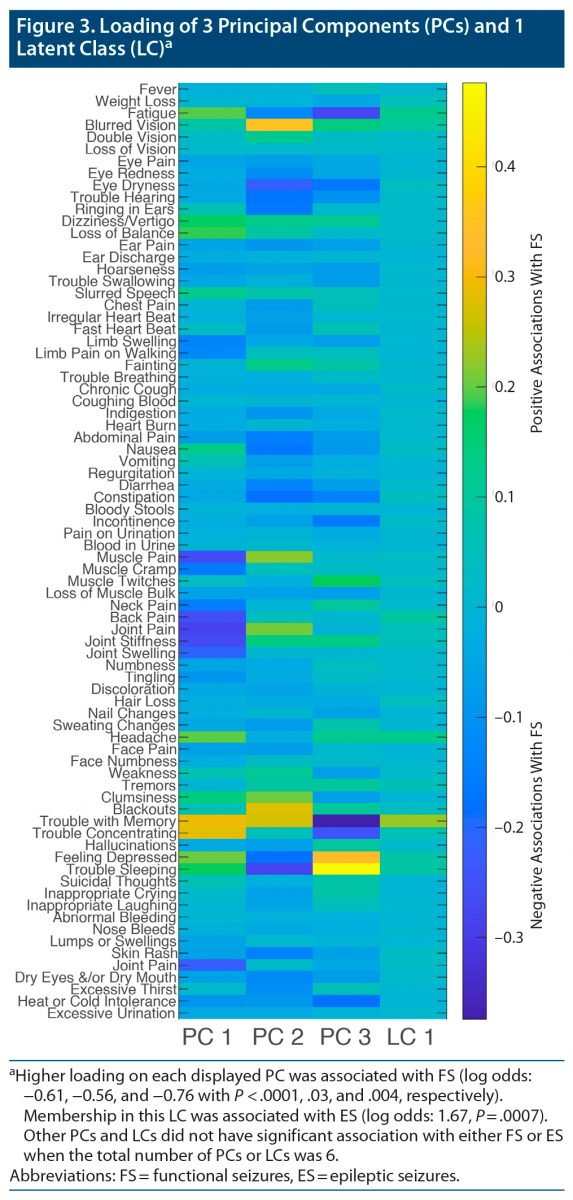
Figure 2 illustrates the pattern of the ROSQ responses when assessed by t-SNE. We illustrate the 3 principal components and 1 latent cluster that was significantly different between FS and ES when considering the first 6 principal components or 6 latent clusters in Figure 3. Higher loading on each displayed principal components was associated with FS (log odds: −0.61, −0.56, and −0.76 with P < .0001, 0.03, and 0.004, respectively). Membership in this latent class was associated with ES (log odds: 1.67, P = .0007).
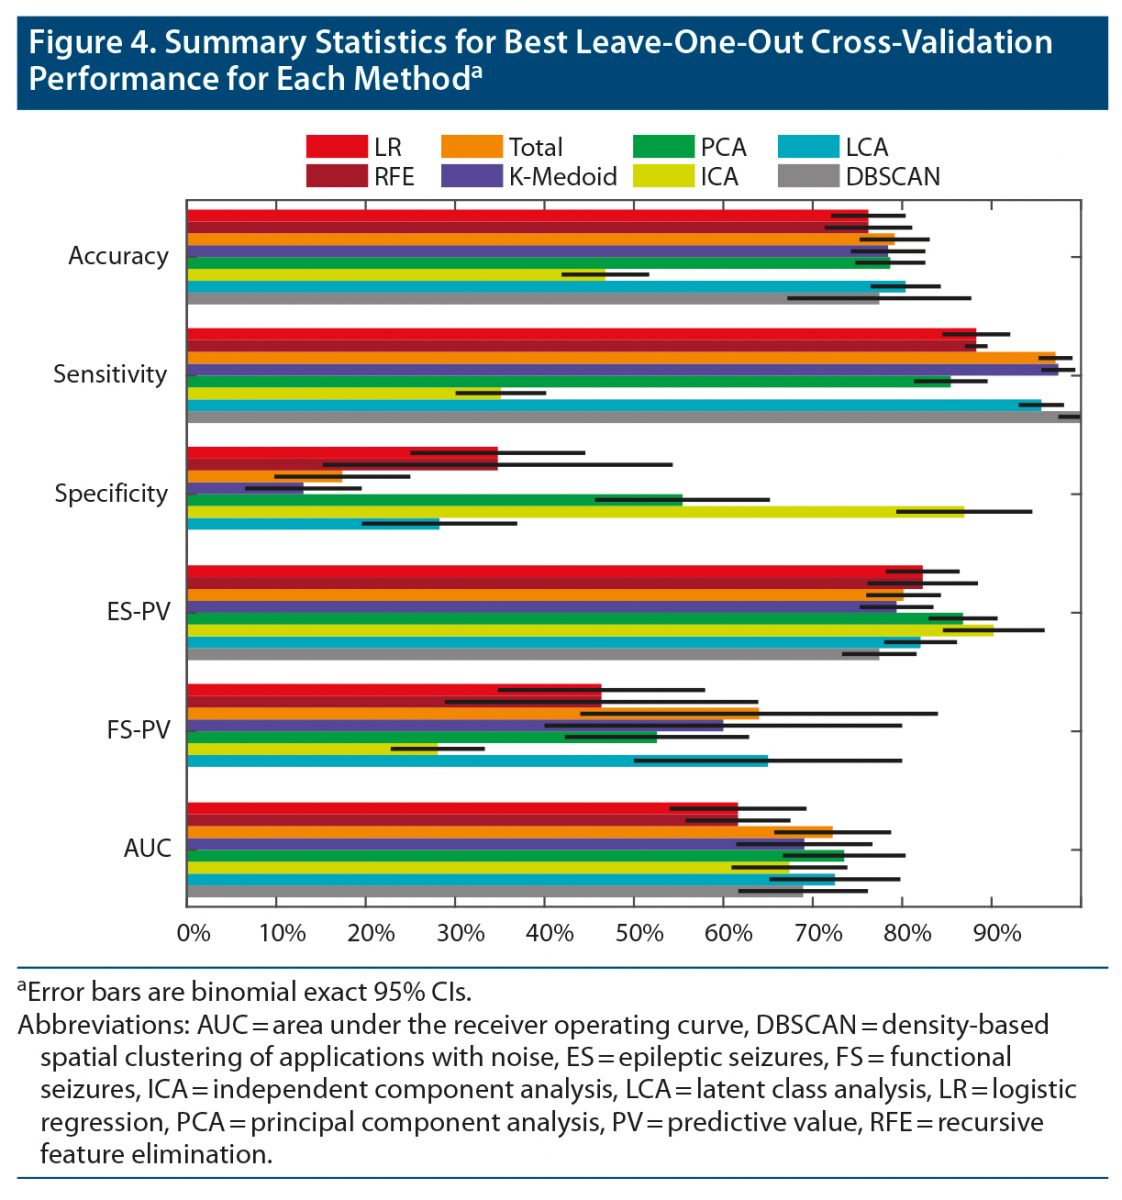
The best leave-one-out performance of each approach is illustrated in Figure 4, and exact values are listed in Supplementary Table 1. The AUC of the total symptoms, principal component analysis, and latent class analysis was significantly higher than the AUC of the individual symptom and RFE models (bootstrap with 50,000 permutations, P < .01). No other pairwise comparisons of AUC were significantly different (P > .1). The maximum performance for principal component analysis and latent class analysis was achieved with 19 components and 27 clusters. Both methods had a local maximum at 6 components/clusters with an AUC less than 1% worse than the global maximum (Supplementary Figure 2).
DISCUSSION
These data-driven analyses of ROSQs revealed no clinically useful subpopulations or patterns of responses that could identify patients with FS compared to patients with ES.11 While the average patient with FS reported more positive ROSQ symptoms than patients with ES, the variability was too large to be diagnostic clinically.9–11
The difference of averages may reflect the substantial perceived impact of seizures and other comorbid diseases on quality of life in patients with FS.27–30 This nonspecific increase in ROSQ symptoms confirmed the common clinical observation that some patients with FS have “pan-positive” ROS responses and that as more symptoms are noted, the likelihood of FS increases.9–11 However, our total symptom model suggested that the threshold of reporting more than 28 of 78 symptoms (35% positive) maximized the accuracy in differentiating patients with FS compared to ES, but the specificity was 17%, and the predictive value for FS was 64%. Therefore, a pan-positive ROS occurs uncommonly in FS, and a substantial number of patients with ES also report many ROS symptoms. The difference between our predictive results and prior evaluations of ROSQs with artificially equal numbers of patients with FS and ES also highlights the difference between population-level descriptive statistics and the influence of pre-test probability on applying statistical results to individual patients.
There are several reasons why these data-driven approaches to identify symptom phenotypes from ROSQ responses did not seem to identify meaningful symptom phenotypes within ES and FS. The goal of these unsupervised approaches is to maximize the amount of variation explained. As suggested by 3 of the 6 top principal components not being associated with FS or ES and the relatively admixed cloud in Figure 1, there likely are factors not related to their diagnosis that contribute to patients’ ROS symptoms. Therefore, despite prior results suggesting the ROSQs could screen for functional seizures, as CMS documentation requirements in 2021 no longer require ROSQs for outpatient encounters, we believe that patient and provider time could be redirected toward evaluations designed more specifically for seizures.
Prior to diagnosis of FS, many patients receive antiseizure medications, which have adverse effects.31 However, there was no significant correlation between any component or phenotype and the number of current antiseizure medications (data not shown). Similarly, there were no significant correlations between any principal component in the best model and patient age, sex, or ictal behavior (data not shown). In addition to these confounding factors, the social, physical, and emotional impacts of frequent, unpredictable seizures can be similar between patients with FS and ES including impacts on driving, employment, physical injury and resulting pain, and depression.28,32,33
In support of a focused approach instead of the general approach of ROSQs, McKenzie and colleagues27 found that medically unexplained symptoms did not independently contribute to long-term unemployment, suggesting that measuring other factors like psychiatric comorbidities may better describe the impact of FS on patients’ lives. The Epilepsy Quality Measurement Set assesses many of these factors by asking about seizure severity, medication side effects, depression, anxiety, and quality of life in epilepsy.34 While the Epilepsy Quality Measurement Set focuses on the impact of seizures, the Functional Seizures Likelihood Score,25 Paroxysmal Event Observer,35 and Anxiety, Abuse and Somatization Questionnaire36 were designed to differentiate between patients with FS and ES. Therefore, as CMS documentation no longer requires ROSQs in 2021 (the time of this writing), and based on the results of the current analysis, we favor these assessments that are more relevant to the diagnosis and management of seizure and, conveniently, include fewer questions. The difference between these seizure-specific measures and the ROSQs reflects the goal of ROSQs to generalize well across all medical and mental health conditions, and thus it is not specifically designed to evaluate common problems associated with seizures.
To maximize the initial sample size, we included patients with FS, ES, mixed ES plus FS, PSLE, and inconclusive monitoring. While this strategy improved statistical power in the clustering and projection step through semi-supervised learning, there may be unique patterns in patients with mixed ES plus FS or those with PSLE. This approach may have slightly reduced the power of our logistic regression through the “curse of dimensionality” by including a component or cluster that was noninformative for the differentiation of FS and ES.37 The small reduction in AUC of each algorithm as the number of clusters or components increased suggests that the logistic regression models were not limited by modeling too many variables (Supplementary Figure 2). When screening for FS, one must also consider the differential of mixed ES plus FS and PSLE; therefore, we favor inclusion of these patients despite limited sample size.
Due to our focus on patient screening, we analyzed the first available ROSQ. The low response of 54% reflects clinical practice wherein some providers prefer to perform ROSQ manually, reviewed but did not scan the standard ROSQ, or chose another method. We did not include manually entered ROSQ information due to substantial evidence that this may not coincide with observed behavior.38 The variety of settings (outpatient vs inpatient) and sources of information (patient vs caregiver) also may contribute different patterns to the responses. This complexity, however, resembles the complexity of analyzing questionnaires as part of routine clinical practice.
An important limitation in our approach is that each piece of clinical information should be viewed within the context of an individual patient. We did not evaluate here how ROSQ responses could interact with patient history, reported ictal behavior, neurodiagnostic testing, and videos of seizures, all of which substantially contribute to the certainty of the diagnosis of FS. When considering an equivocal evaluation or complex patient, a pan-positive ROSQ may prompt an appropriate referral to vEEG monitoring.
CONCLUSION
On a population level, patients with FS report more symptoms on ROSQs than patients with ES, but both populations are extremely heterogeneous. Data-driven symptom phenotype discovery methods applied to ROSQ did not meaningfully identify or quantify this heterogeneity. The most informative feature of ROSQs to differentiate FS from ES was the total number of symptoms, but this had extremely poor specificity.
Submitted: June 13, 2021; accepted September 14, 2021.
Published online: March 15, 2022.
Potential conflicts of interest: Drs Engel, Stern, and Kerr have clinical responsibilities that include the diagnosis and treatment of patients with epilepsy and nonepileptic seizures. The remaining authors have no declared conflicts of interest.
Funding/support: This work was supported by NIH R25 NS065723, the UCLA-California Institute of Technology Medical Scientist Training Program (NIH T32 GM08042), the Neuroimaging Training Program (NIH T90 DA022768, R90 DA022768 & R90 DA023422), the UCLA Systems and Integrative Biology Training Program (NIH T32 GM008185), the William M. Keck Foundation, and research grants to Dr Engel (NS03310 & NS080181).
Role of the sponsor: The sponsor had no role in the preparation of this work.
Acknowledgments: The authors thank William Stacey, MD, PhD (Department of Neurology, University of Michigan, Ann Arbor, Michigan); Kirk Shattuck, BS (Department of Neurology, University of California Los Angeles, Los Angeles, California); Marc Nuwer, MD, PhD (Department of Neurology, University of California Los Angeles, Los Angeles, California); and Edward P. Lau, MS (Department of Psychiatry and Biobehavioral Sciences, University of California Los Angeles, Los Angeles, California) for helpful comments, organization support, access to the data, and technical support.
Supplementary material: See accompanying pages.
Clinical Points
- Clustering and projection methods did not identify patterns of responses that had reliable interpretations.
- Clustering and projection methods did not improve the differentiation of functional seizures from epileptic seizures.
- The raw sum of positive review-of-systems responses performed better than any clustering or projection method.
References (38)

- Asadi-Pooya AA, Brigo F, Mildon B, et al. Terminology for psychogenic nonepileptic seizures: making the case for “functional seizures”. Epilepsy Behav. 2020;104(Pt A):106895. PubMed CrossRef
- Kerr WT, Stern JM. We need a functioning name for PNES: consider dissociative seizures. Epilepsy Behav. 2020;105:107002. PubMed CrossRef
- Beghi M, Peroni F, Cornaggia CM. Reply to: we need a functioning name for PNES: considering dissociative seizures. Epilepsy Behav. 2020;109:107084. PubMed CrossRef
- Dickinson P, Looper KJ. Psychogenic nonepileptic seizures: a current overview. Epilepsia. 2012;53(10):1679–1689. PubMed CrossRef
- Alessi R, Valente KD. Psychogenic nonepileptic seizures: should we use response to AEDS as a red flag for the diagnosis? Seizure. 2014;23(10):906–908. PubMed CrossRef
- Goldstein LH, Robinson EJ, Mellers JDC, et al; CODES study group. Cognitive behavioural therapy for adults with dissociative seizures (CODES): a pragmatic, multicentre, randomised controlled trial. Lancet Psychiatry. 2020;7(6):491–505. PubMed CrossRef
- LaFrance WC Jr, Baird GL, Barry JJ, et al; NES Treatment Trial (NEST-T) Consortium. Multicenter pilot treatment trial for psychogenic nonepileptic seizures: a randomized clinical trial. JAMA Psychiatry. 2014;71(9):997–1005. PubMed CrossRef
- Libbon R, Gadbaw J, Watson M, et al. The feasibility of a multidisciplinary group therapy clinic for the treatment of nonepileptic seizures. Epilepsy Behav. 2019;98(Pt A):117–123. PubMed CrossRef
- Robles L, Chiang S, Haneef Z. Review-of-systems questionnaire as a predictive tool for psychogenic nonepileptic seizures. Epilepsy Behav. 2015;45:151–154. PubMed CrossRef
- Asadi-Pooya AA, Rabiei AH, Tinker J, et al. Review of systems questionnaire helps differentiate psychogenic nonepileptic seizures from epilepsy. J Clin Neurosci. 2016;34:105–107. PubMed CrossRef
- Kerr WT, Janio EA, Braesch CT, et al. Diagnostic implications of review-of-systems questionnaires to differentiate epileptic seizures from psychogenic seizures. Epilepsy Behav. 2017;69:69–74. PubMed CrossRef
- LaFrance WC Jr, Baker GA, Duncan R, et al. Minimum requirements for the diagnosis of psychogenic nonepileptic seizures: a staged approach: a report from the International League Against Epilepsy Nonepileptic Seizures Task Force. Epilepsia. 2013;54(11):2005–2018. PubMed CrossRef
- LaFrance WC Jr, Devinsky O. The treatment of nonepileptic seizures: historical perspectives and future directions. Epilepsia. 2004;45(suppl 2):15–21. PubMed CrossRef
- Iturria-Medina Y, Pérez Fernández A, Morris DM, et al. Brain hemispheric structural efficiency and interconnectivity rightward asymmetry in human and nonhuman primates. Cereb Cortex. 2011;21(1):56–67. PubMed CrossRef
- Perez DL, LaFrance WC Jr. Nonepileptic seizures: an updated review. CNS Spectr. 2016;21(3):239–246. PubMed CrossRef
- Sansone RA, Lam C, Wiederman MW. Responses to the medical review of systems: borderline versus nonborderline patients in an internal medicine outpatient clinic. Prim Care Companion CNS Disord. 2011;13(3):13. PubMed CrossRef
- Kerr WT, Janio EA, Braesch CT, et al. An objective score to identify psychogenic seizures based on age of onset and history. Epilepsy Behav. 2018;80:75–83. PubMed CrossRef
- Reuber M. Trauma, traumatisation, and functional neurological symptom disorder-what are the links? Lancet Psychiatry. 2018;5(4):288–289. PubMed CrossRef
- Baroni G, Piccinini V, Martins WA, et al. Variables associated with co-existing epileptic and psychogenic nonepileptic seizures: a systematic review. Seizure. 2016;37:35–40. PubMed CrossRef
- van der Maaten LJP, Hinton GE. Visualizing data using t-SNE. J Mach Learn Res. 2008;9:2579–2605.
- Guyon I, Elisseeff A. An introduction to variable and feature selection. J Mach Learn Res. 2003;3:1157–1182.
- Pulini AA, Kerr WT, Loo SK, et al. Classification accuracy of neuroimaging biomarkers in attention-deficit/hyperactivity disorder: effects of sample size and circular analysis. Biol Psychiatry Cogn Neurosci Neuroimaging. 2019;4(2):108–120. PubMed CrossRef
- Kottas M, Kuss O, Zapf A. A modified Wald interval for the area under the ROC curve (AUC) in diagnostic case-control studies. BMC Med Res Methodol. 2014;14(1):26. PubMed CrossRef
- Kerr WT, Zhang X, Hill CE, et al. Factors associated with delay to video-EEG in dissociative seizures. Seizure. 2021;86:155–160. PubMed CrossRef
- Kerr WT, Janio EA, Chau AM, et al. Objective score from initial interview identifies patients with probable dissociative seizures. Epilepsy Behav. 2020;113:107525. PubMed CrossRef
- Kerr WT, Zhang X, Janio EA, et al. Reliability of additional reported seizure manifestations to identify dissociative seizures. Epilepsy Behav. 2021;115:107696. PubMed
- McKenzie PS, Oto M, Graham CD, et al. Medically unexplained symptoms in patients with PNES: do they explain poor employment outcome in patients with good seizure outcomes? Epilepsy Behav. 2016;59:9–12. PubMed CrossRef
- Rawlings GH, Brown I, Reuber M. Predictors of health-related quality of life in patients with epilepsy and psychogenic nonepileptic seizures. Epilepsy Behav. 2017;68:153–158. PubMed CrossRef
- Jennum P, Ibsen R, Kjellberg J. Welfare consequences for people diagnosed with nonepileptic seizures: a matched nationwide study in Denmark. Epilepsy Behav. 2019;98(Pt A):59–65. PubMed CrossRef
- Robson C, Drew P, Walker T, et al. Catastrophising and normalising in patient’s accounts of their seizure experiences. Seizure. 2012;21(10):795–801. PubMed CrossRef
- Kerr WT, Janio EA, Le JM, et al. Diagnostic delay in psychogenic seizures and the association with anti-seizure medication trials. Seizure. 2016;40:123–126. PubMed CrossRef
- Abe C, Denney D, Doyle A, et al. Comparison of psychiatric comorbidities and impact on quality of life in patients with epilepsy or psychogenic nonepileptic spells. Epilepsy Behav. 2020;102:106649. PubMed CrossRef
- Engelberts NH, Klein M, van der Ploeg HM, et al. Cognition and health-related quality of life in a well-defined subgroup of patients with partial epilepsy. J Neurol. 2002;249(3):294–299. PubMed CrossRef
- Patel AD, Baca C, Franklin G, et al. Quality improvement in neurology: Epilepsy Quality Measurement Set 2017 update. Neurology. 2018;91(18):829–836. PubMed CrossRef
- Wardrope A, Jamnadas-Khoda J, Broadhurst M, et al. Machine learning as a diagnostic decision aid for patients with transient loss of consciousness. Neurol Clin Pract. 2020;10(2):96–105. PubMed
- Trainor D, Foster E, Rychkova M, et al. Development and validation of a screening questionnaire for psychogenic nonepileptic seizures. Epilepsy Behav. 2020;112:107482. PubMed CrossRef
- Mwangi B, Tian TS, Soares JC. A review of feature reduction techniques in neuroimaging. Neuroinformatics. 2014;12(2):229–244. PubMed CrossRef
- Berdahl CT, Moran GJ, McBride O, et al. Concordance between electronic clinical documentation and physicians’ observed behavior. JAMA Netw Open. 2019;2(9):e1911390. PubMed CrossRef
Enjoy this premium PDF as part of your membership benefits!